Figure 4.
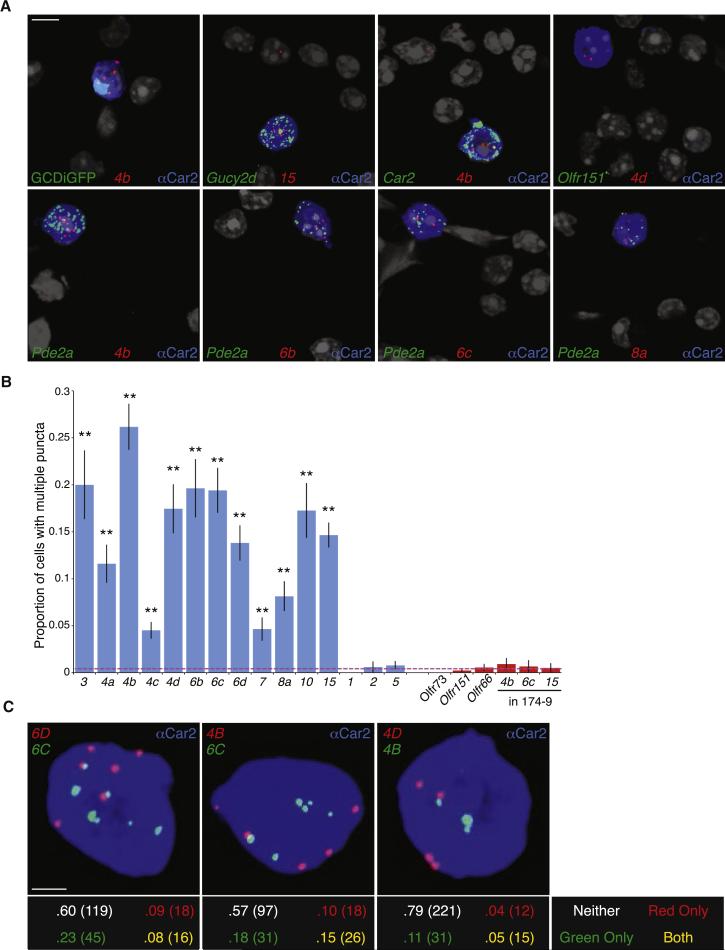
Multiple Ms4a genes are expressed in each necklace sensory neuron. A. RNAScope single molecule fluorescent in situ hybridization of dissociated olfactory epithelial cells detects Ms4a family members (red). Necklace cells identified via co-labeling with an antibody against Car2 (blue), GFP from the Gucy2d-IRES-TauGFP allele (green, top left) or an RNAScope probe against a necklace marker gene (green, all panels except the top left). Necklace cells are not marked by a probe against the conventional OR gene Olfr151 (top right). Nuclei marked by DAPI (grayscale); cytoplasmic anti-CAR2 signal was saturated to demarcate the entire volume of each GC-D cell. Scale bar 5 μM. B. Proportion of Car2+ necklace OSNs with two or more detected puncta for each Ms4a (blue bars) and Olfr probe (red bars, including Ms4a puncta in OR174-9-IRES-GFP expressing cells; n=3 experiments, between 150-750 cells/probe, error bars are standard error of the proportion). Dashed red line represents the average value of negative controls. All Ms4a probes (other than negative controls Ms4a1, Ms4a2, Ms4a5) give a significantly higher proportion of positive cells than negative controls (p < .01, one-tailed Z test on population proportions). C. Representative images of Car2+ (blue) cells labeled with probes against the indicated Ms4a family members (top panels). The proportion and total number of cells with multiple puncta for neither, one, or both colors was quantified (bottom panels, total cell number in parentheses). Each pair shows significantly more double-positive cells (yellow) than expected (p < .05, Fisher's Exact Test on 2×2 table). Scale bar 2 μM. See also Figure S5.

