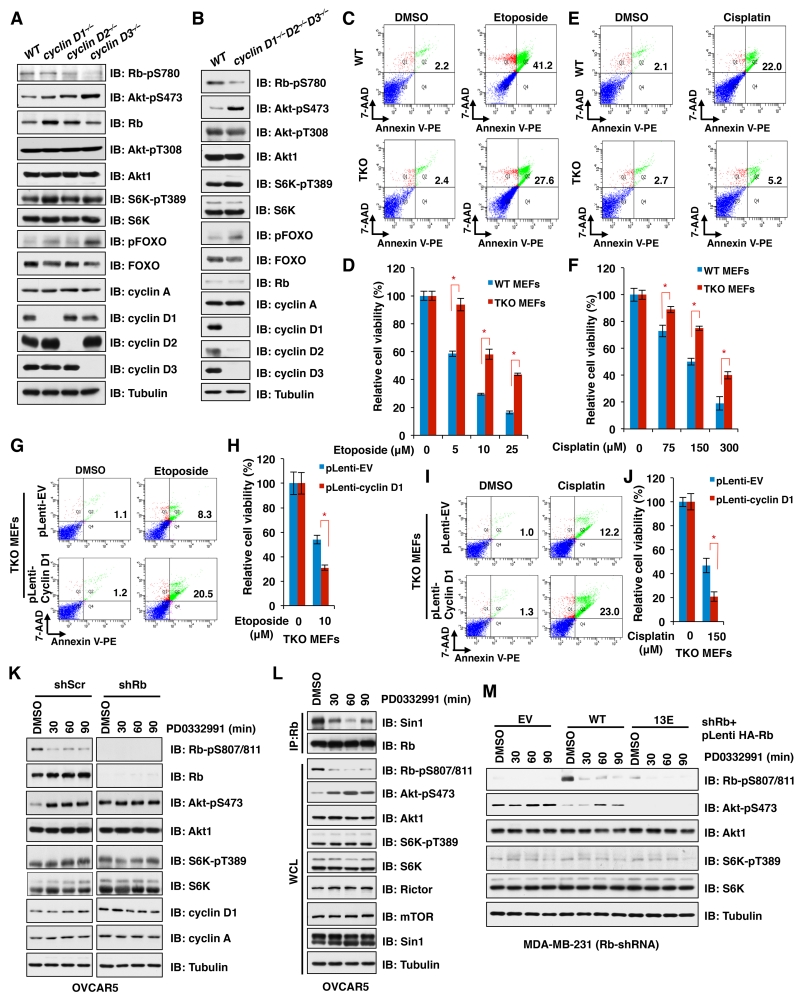
Figure 5. Inhibition of CDK4/cyclin D-mediated Rb phosphorylation by either genetic deletion of cyclin D or CDK4/6 inhibitor treatment leads to activation of mTORC2 to confer resistance to chemotherapeutic drugs.
A. IB analysis of WCL derived from wild type MEFs, cyclin D1−/− MEFs, cyclin D2−/− MEFs and cyclin D3−/− MEFs.
B. IB analysis of WCL derived from wild type MEFs and cyclin D1−/−D2−/−D3−/− triple knockout (TKO) MEFs.
C and E. Wild type and TKO MEFs were treated with etoposide (10 μM) (C) or cisplatin (150 μM) (E) for 24 h. Cellular apoptosis was analyzed by flow cytometry.
D and F. Wild type and TKO MEFs were treated with indicated concentration of etoposide (D) or Cisplatin (F) for 24 h before performing cell viability assay. Data are shown as mean ± s.d. from three independent experiments. * p<0.05 (t-test)
G and I. TKO MEFs stable expression of cyclin D1 via lentiviral infection (with EV as a negative control) were treated with etoposide (10 μM) (G) or cisplatin (150 μM) (I) for 24 h before performing cell apoptosis assays.
H and J. TKO MEFs stably expressing cyclin D1 via lentiviral infection (with EV as a negative control) were treated with etoposide (10 μM) (H) or cisplatin (150 μM) (J) for 24 h before performing cell viability assay. Data are shown as mean ± s.d. from three independent experiments. * p<0.05 (t-test)
K. Rb-depleted OVCAR5 cells (with shScramble as a negative control) were treated with PD0332991 (500 nM) for the indicated time periods before harvesting for IB analysis.
L. IB analysis of WCL and endogenous Rb-immnuoprecipitates (IP) derived from OVCAR5 cells treated with PD0332991 (500 nM) for the indicated time periods.
M. Rb-depleted MDA-MB-231 cells stably expressing the indicated Rb constructs were treated with PD0332991 (500 nM) for the indicated time periods before harvesting for IB analysis.
(See also Figure S5)

