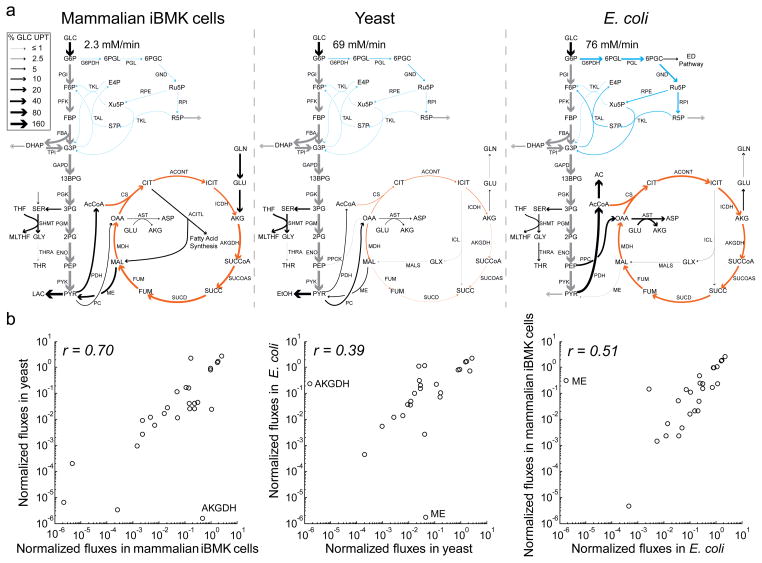
Figure 2. Metabolic flux distributions in mammalian iBMK cells, yeast, and E. coli.
Fluxes were determined by integrating direct nutrient uptake and waste secretion rate measurements and data from multiple isotope tracers by metabolic flux analysis. (a) Net fluxes. Arrow widths indicate absolute magnitudes of fluxes, normalized to glucose uptake, as per the legend. Absolute magnitude of glucose uptake is shown for each organism. Grey, glycolysis; blue, pentose phosphate pathway; orange, TCA cycle; black, other. (b) Comparison of normalized net fluxes across organisms. Fluxes were normalized to the organism’s glucose uptake rate. Plotted data are restricted to linearly independent fluxes (e.g., lower glycolysis is shown once per graph, not repeatedly for each pathway enzyme).

