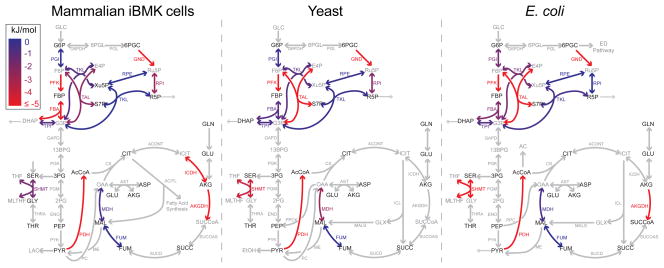
Figure 3. Reaction free energy determined with isotope tracers in mammalian iBMK cells, yeast, and E. coli.
Flux reversibility and ΔG were determined from forward and backward fluxes. Blue, equilibrium (ΔG ≈ 0 kJ/mol); red, substantially forward driven (ΔG ≤ −5 kJ/mol); grey, not measured based solely on isotope tracer data (for reversibility of glycolytic reactions inferred from combined flux and concentration data, see Fig. 4b).

