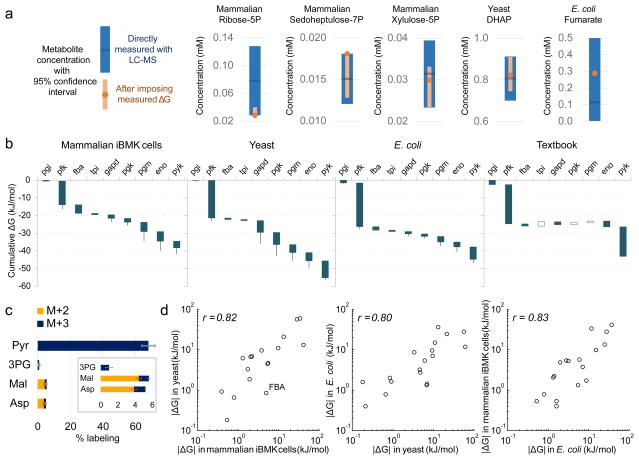
Figure 4. Integration of flux and concentration measurements via ΔG.
(a) The absolute concentrations of those metabolites involved in reactions with ΔG determined from reaction reversibility (Fig. 3b) were refined by combining confidence intervals from direct LC-MS measurement of their concentrations (blue) with thermodynamic constraints to obtained more precise values (orange). For example, the concentration of fumarate is informed also by that of malate, in combination with the reversibility of fumarase. (b) ΔG for glycolysis based on integration of metabolite concentrations and reaction reversibilities. Blue and white bars depict negative and positive ΔG, respectively. Whiskers show 95% confidence limits (see Methods). (c) An unexpected finding from the thermodynamic analysis in (b) is partial reversibility of pyruvate kinase. To demonstrate directly this reversibility, [U-13C]-pyruvate (0.45 mM) was added to the media of growing iBMK cells for 20 min and upstream and downstream metabolites were analyzed for labeling. Error bars represent standard errors of the means (n=3). (d) Comparison of ΔG across organisms. Plotted data are for all measured reactions with ΔG < −0.1 kJ/mol.

