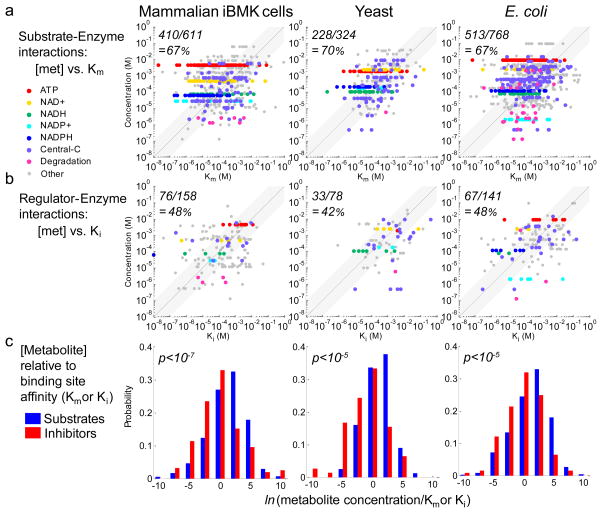
Figure 6. Comparison of absolute concentrations to enzyme binding site affinities for substrates and for inhibitors.
(a, b) Comparison of absolute metabolite concentrations (Y-axis) to enzyme binding site affinities (X-axis). The fraction of concentrations exceeding Km or Ki (i.e., data points above the line of unity) is shown in the top left of each graph. (c) Enzyme active sites are in general more saturated than inhibitor sites (p-values are from the Kolmogorov-Smirnov test).

