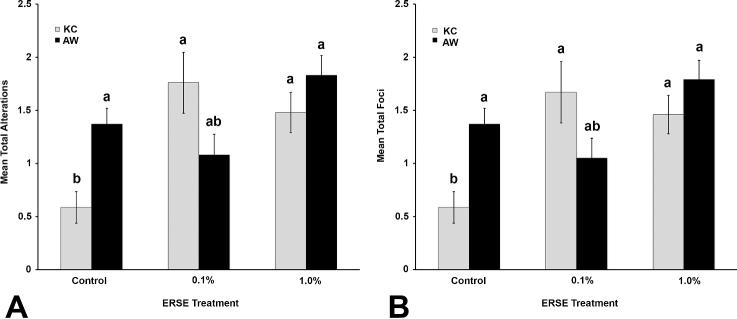
FIGURE 3.
Histogram representing total alterations (A) and total foci (B) in King's Creek (gray bars) and Atlantic Wood (black bars) populations across all ERSE treatment groups. Bars represent means of transformed data with error bars representing standard error of the mean. Different letters indicate statistical differences. Nested ANOVA with post-hoc Tukey test (p≤0.05).

