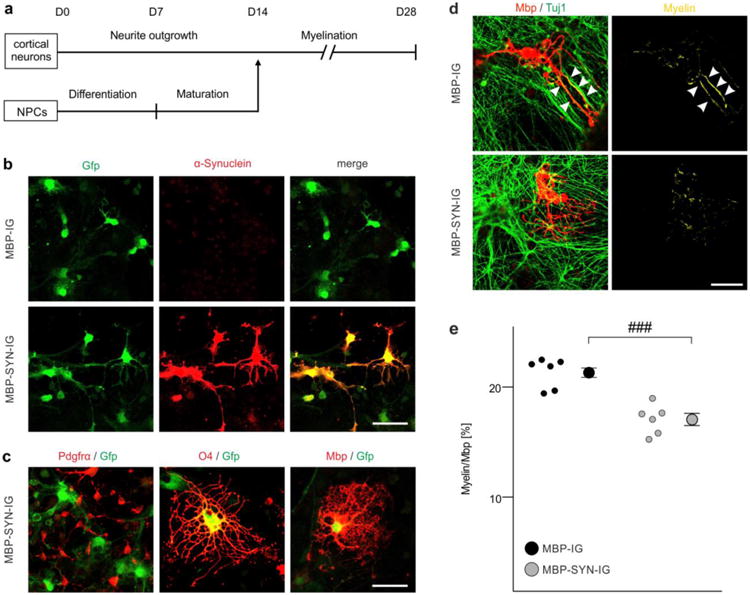
Fig. 3.

Impaired myelination of α-synuclein-overexpressing mouse embryonic stem cell-derived oligodendrocytes. a The experimental paradigm to analyze myelination of individual oligodendrocytes in the mouse embryonic stem cell-derived oligodendrocyte-neuron co-culture is schematically illustrated according to [25]. b Stem cell-derived oligodendrocytes expressed human α-synuclein (when transduced with MBP-SYN-IG expression vector only; lower panel) and green fluorescent protein (Gfp) (also when transduced with the MBP-IG control vector; upper panel). Expression of α-synuclein overlapped with GFP expression in MBP-SYN-IG transduced oligodendrocytes. Scale bar: 20μm. c Co-labeling with stage-specific oligodendrocytic markers revealed the specificity of myelin basic protein (Mbp) promoter-driven transgene expression for mature oligodendrocytes (positive for the early maturation marker O4 and Mbp as a marker for terminal maturation), whereas transgene expression was not detectable in platelet-derived growth factor receptor-α (Pdgfrα)-positive oligodendrocyte progenitor cells. Scale bar: 20μm. d Representative images of control (transduced with MBP-IG prior to starting the co-culture) and α-synuclein-overexpressing (transduced with MBP-SYN-IG) Mbp-positive oligodendrocytes co-cultured with beta-III-tubulin (Tuj1)-positive cortical neurons are depicted. Myelination (yellow; arrowheads) was regularly detected under control condition, whereas α-synuclein overexpression impaired myelin formation. Scale bar: 20μm. e Myelination of individual oligodendrocytes (altogether: MBP-IG: 235 cells, MBP-SYN-IG: 215 cells) in the stem cell-derived co-culture was quantified (n = 6) by calculating the ratio of Mbp/Tuj1-positive pixels over total Mbp-positive pixels and is shown as percentage. α-Synuclein-overexpressing oligodendrocytes (gray dots) formed significantly less myelin than controls (black dots). Data are shown as mean ± standard error of mean. T-test: ###p < 0.001.
