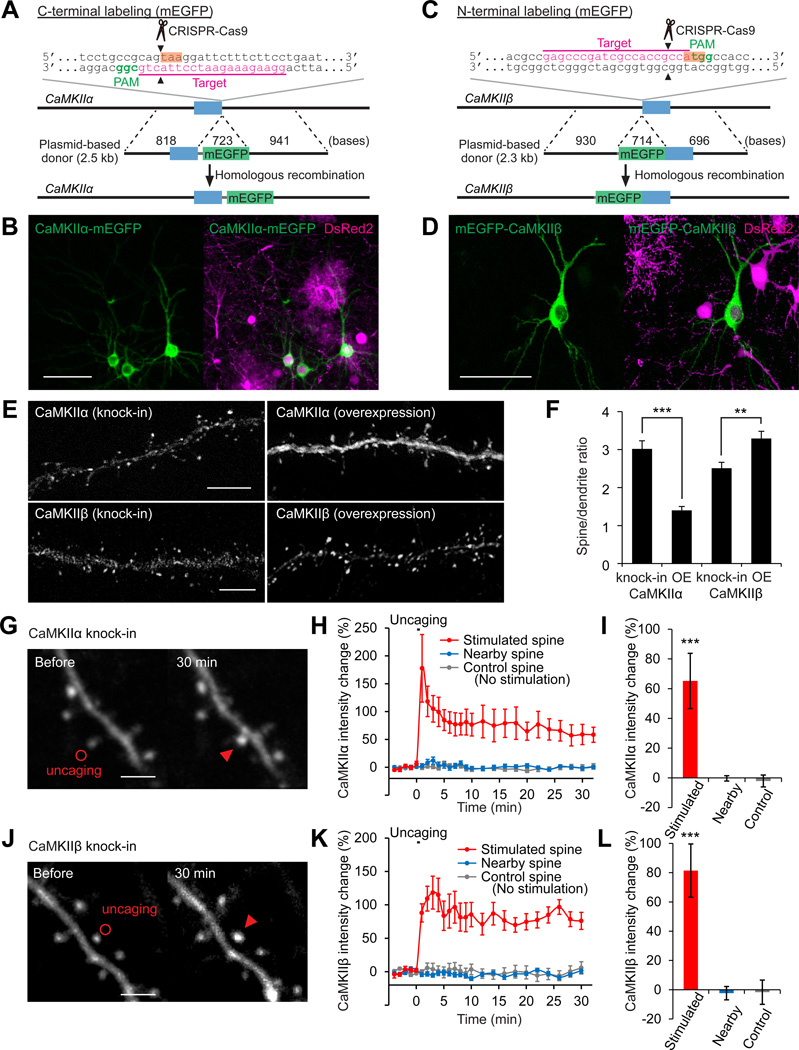
Figure 6. Localization and Dynamics of Endogenous Proteins Labeled with mEGFP by SLENDR.
(A and C) Graphical representation of the mouse genomic loci of CaMKIIα (A) and CaMKIIβ (C) showing the targeting sites for Cas9, sgRNA and HDR donor plasmid. The sgRNA targeting sequences are underlined and labeled in magenta. The PAM sequences are labeled in green. The stop and start codons of CaMKIIα (A) and CaMKIIβ (C) are marked in orange.
(B and D) Confocal microscopic images of the somatosensory cortex showing the fluorescence of DsRed2 (magenta) and mEGFP (green) fused to CaMKIIα/β.
(E) Images of apical secondary dendrites in layer 2/3 fixed at P14 showing mEGFP-tagged endogenous (knock-in) or overexpressed (OE) CaMKIIα/β.
(F) The spine/dendrite ratio of the peak intensities of mEGFP-tagged CaMKIIα/β. CaMKIIα, knock-in, n = 51/6 (spines/neurons); OE, n = 40/5. CaMKIIβ, knock-in, n = 58/4; OE, n = 83/5. (G-L) Two-photon microscopic images before and 30 min after glutamate uncaging showing mEGFP-tagged endogenous CaMKIIα/β in layer 2/3 neurons (G and J). Red circles, uncaging spots; red arrowheads, stimulated spines. Averaged time courses (H and K) and sustained values (I and L; averaged over 20–30 min) of CaMKIIα/β intensity change in the stimulated (red; H and I, n = 11/8; K and L, n =9/7), nearby (2–5 µm from the stimulated spines; blue; H and I, n = 31/8; K and L, n =31/7) and control spines with no stimulation (grey; H and I, n = 23/5; K and L, n =13/2). ***p < 0.001, Student’s t test (F) and Dunnett test (I and L).
Data are represented as mean ± SEM.
Scale bars, 50 µm (B and D); 5 µm (E); 2 µm (G and J).
See also Figure S6 and Table S3.

