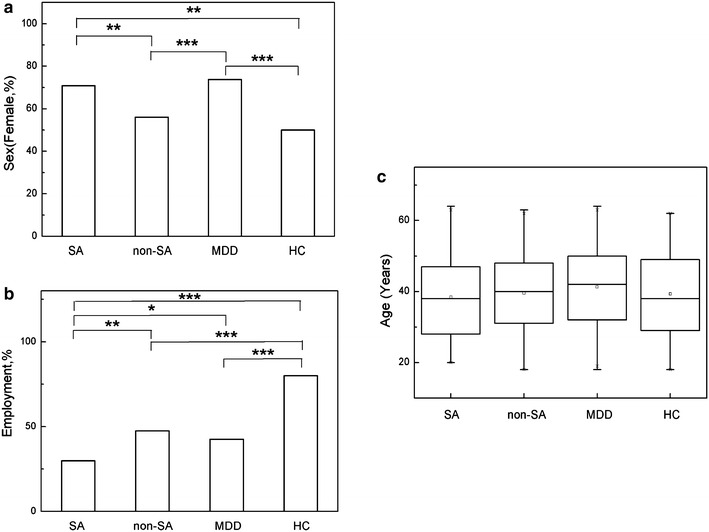
Fig. 1.

Demographics of SA, non-SA, MDD and HC (a sex, b employment, c age). SA suicide attempts patients, non-SA non-suicide attempts patients with psychiatric disorders, MDD major depressive disorder patients, HC healthy controls; data are presented in Median (Q1 and Q3) for age and in percentage for sex and employment
