
Fig. 3.
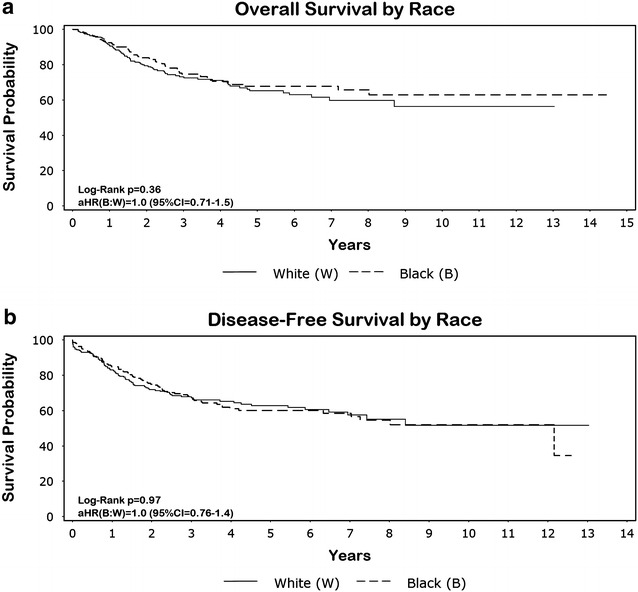
a, b Overal (OS) and disease-free (DFS) survival by race. Adjusted hazard ratios (aHR) and 95 % confidence intervals (CI) are displayed in the lower left-hand corner of the graph
Official websites use .gov
A
.gov website belongs to an official
government organization in the United States.
Secure .gov websites use HTTPS
A lock (
) or https:// means you've safely
connected to the .gov website. Share sensitive
information only on official, secure websites.
a, b Overal (OS) and disease-free (DFS) survival by race. Adjusted hazard ratios (aHR) and 95 % confidence intervals (CI) are displayed in the lower left-hand corner of the graph