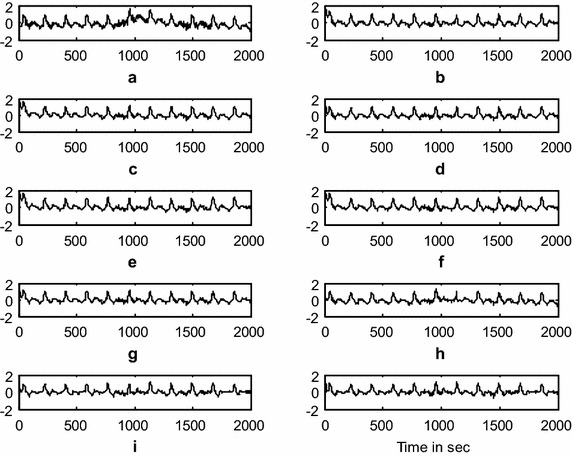
Fig. 9.

Filtering results of the EMA using various AACs (a). Raw ICG with EMA (b). ICG filtering with LMS-updated AAC (c). ICG filtering with exponential non-negative LMS (eN 2LMS)-updated AAC (d). ICG filtering with SReN 2LMS-updated AAC (e). ICG filtering with SEeN 2LMS-updated AAC (f). ICG filtering with SSeN 2LMS-updated AAC (g). ICG filtering with normalized non-negative LMS (N 3LMS)-updated AAC (h). ICG filtering with SRN 3LMS-updated AAC (i). ICG filtering with SEN 3LMS-updated AAC, and (j). ICG filtering with SSN 3LMS-updated AAC. (The x-axis is the number of samples and the y-axis is the signal amplitude in mV)
