Fig. 8.

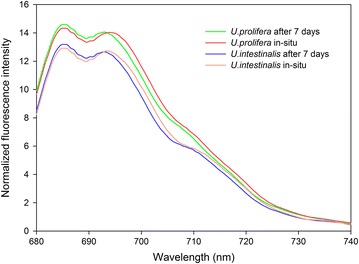
77 K chlorophyll fluorescence emission spectra of thylakoid membranes obtained from in situ and 7 days’ acclimation culture to each. Each curve was the mean of five independent experiments. The excitation wavelength was 436 nm

77 K chlorophyll fluorescence emission spectra of thylakoid membranes obtained from in situ and 7 days’ acclimation culture to each. Each curve was the mean of five independent experiments. The excitation wavelength was 436 nm