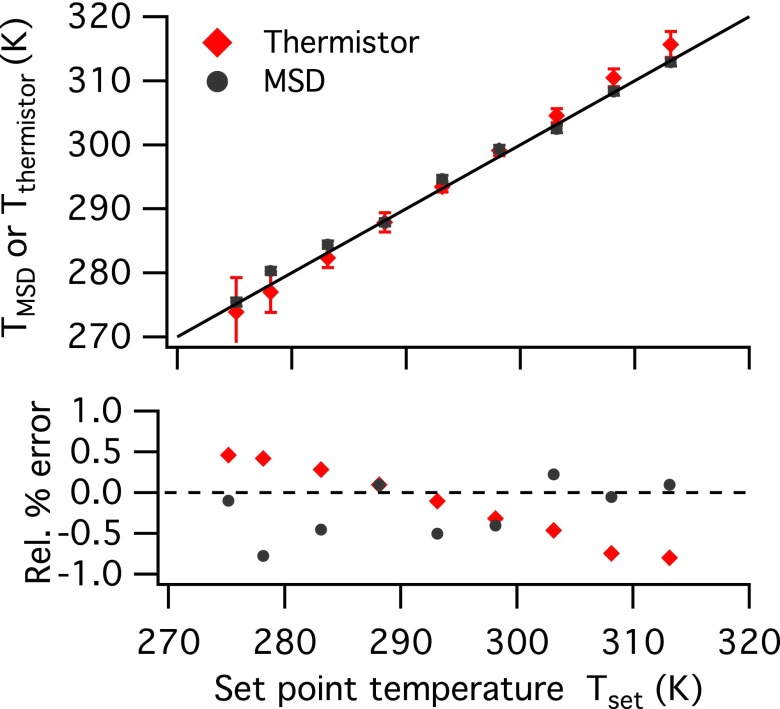
FIG. 5.
Comparison of the measured temperatures from MSD and thermistor, TMSD and Tthermistor, to the set point temperature Tset. The solid line (top) is a parity line, and the dashed line (bottom) indicates 0% error. The error bars for TMSD come from error propagation from particle tracking and Arrhenius fit, and the error bars for Tthermistor come from the temperature fluctuations during the 30-s measurements.

