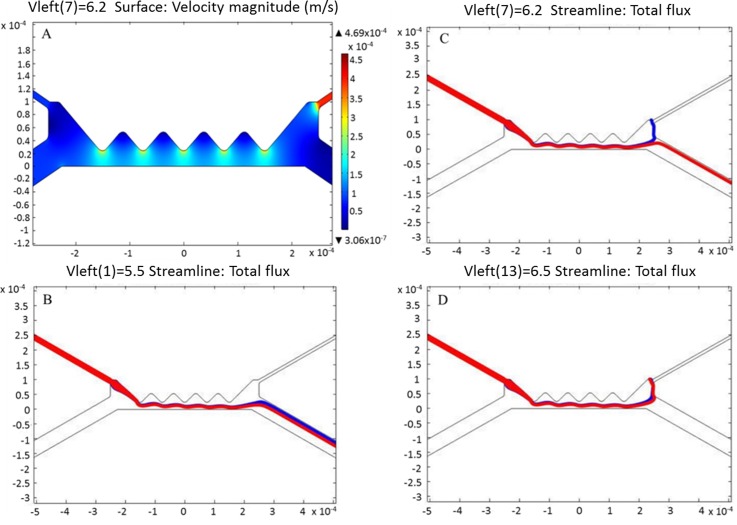
FIG. 3.
Computation velocity and particle flux due to the channel geometry and applied DC voltage. (a) Surface velocity magnitude within the microchannel. (b) Total flux of erythrocytes at the pre-separation stage (at voltage below 6.2 V) (c) Total flux of erythrocytes at the separation stage (at 6.2 V) (d) Total flux of erythrocytes at the post-separation stage (at voltage beyond 6.2 V). Red-color flux represents the healthy (normal) erythrocytes while the blue-color flux depicts the Babesia-infected erythrocytes.

