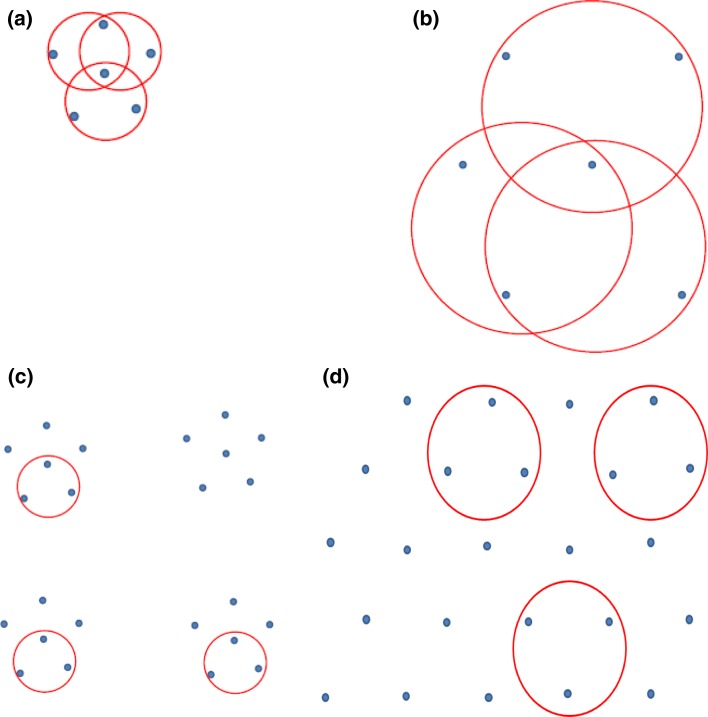
Fig. 1.
Four hypothetical scenarios to describe the distribution of prey (blue dots) and the foraging location of seabirds (red circles); a low resource + high patchiness = small foraging area and high inter-individual overlap, b low resource + low patchiness = large foraging area and high inter-individual overlap, c high resource + high patchiness = small foraging area and small inter-individual overlap, d high resource and low patchiness = large foraging area and small inter-individual overlap

