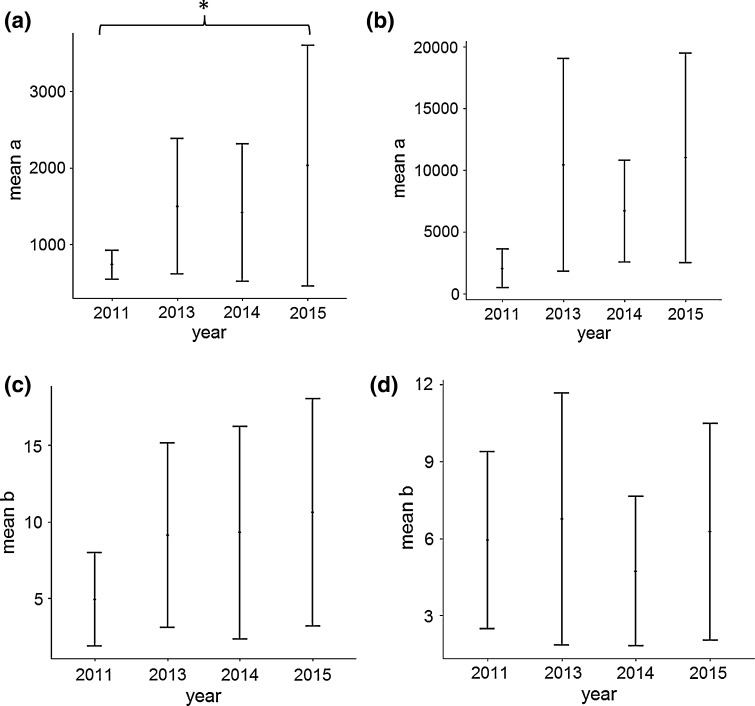
Fig. 7.
Mean size (a) of the a core foraging area (T42 = 2.17, p = 0.036) and b home range area (T42 = 1.63, p = 0.11) and the mean number of trips per individual (b) necessary to reach half of the c core foraging area (T42 = 0.92, p = 0.37) and d home range area (T42 = 0.12, p = 0.90) for an individual bird, predicted using the Michaelis–Menton equation from a sample of tracked northern gannets from Alderney, Channel islands

