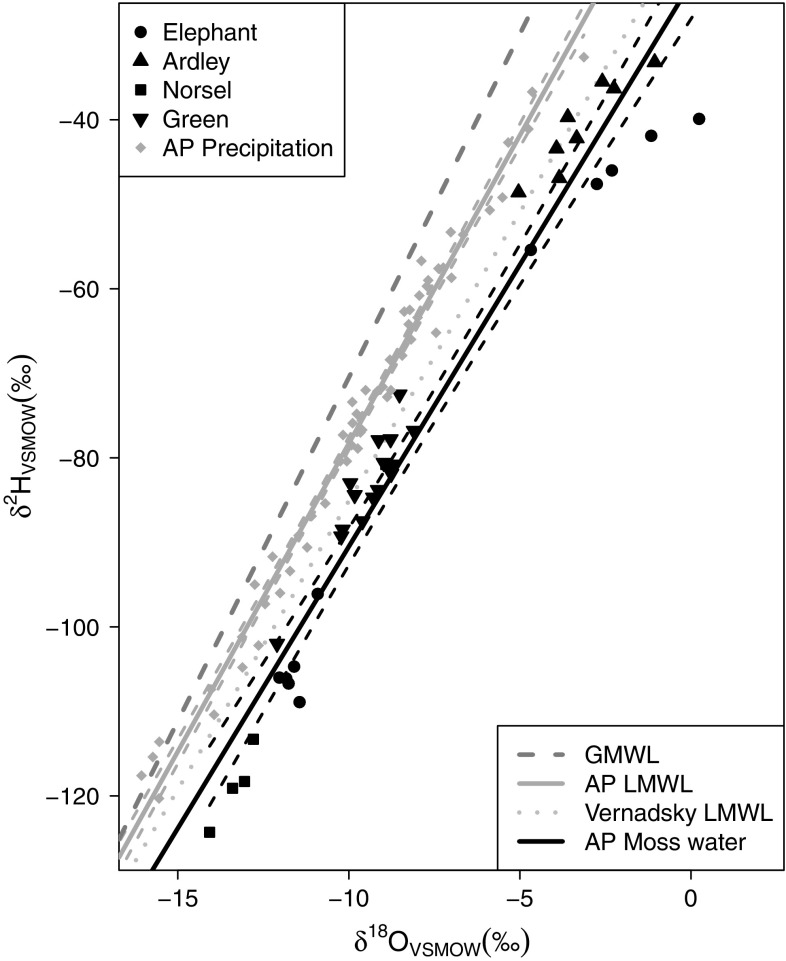
Fig. 4.
Water lines (δ2H vs. δ18O) for AP source water samples (light grey y = 7.3x − 5.4, r 2 = 0.99, n = 57, P < 0.0001) and moss water samples (black y = 6.7x − 23.8, r 2 = 0.95, P < 0.0001) in which water was distilled from surface moss samples. Long dashed line represents the global meteoric water line (GMWL; y = 8x − 10), dotted line is Vernadsky LMWL. Dashed lines represent 95 % confidence intervals of linear models

