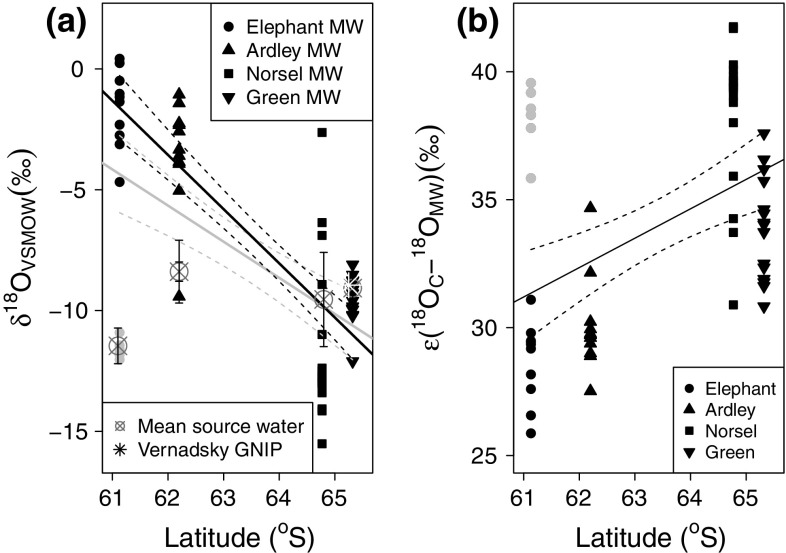
Fig. 5.
a δ18O composition of moss water (MW) as a function of latitude. Dots Elephant Island (ELE; l ight grey dots represent data from ELE sites 2 and 3), upward triangles Ardley Island (ARD), squares Norsel Point (NOR), downward triangles Green Island (GRE). Grey line significant linear model fitted to all data, plotted with 95 % confidence interval; black line significant linear model fitted to black data points (excluding ELE sites 2, 3) plotted with 95 % confidence interval. Grey cross-hairs represent mean δ18O composition of source water (error bars represent SE), white asterisk indicates January precipitation at Vernadsky. b Enrichment of δ18OC relative to δ18Omoss-water as a function of latitude. Black line significant linear model fitted to all data (P = 0.0011, r 2 = 0.14) and plotted with 95 % confidence interval. Light-grey dots represent data from ELE sites 2 and 3

