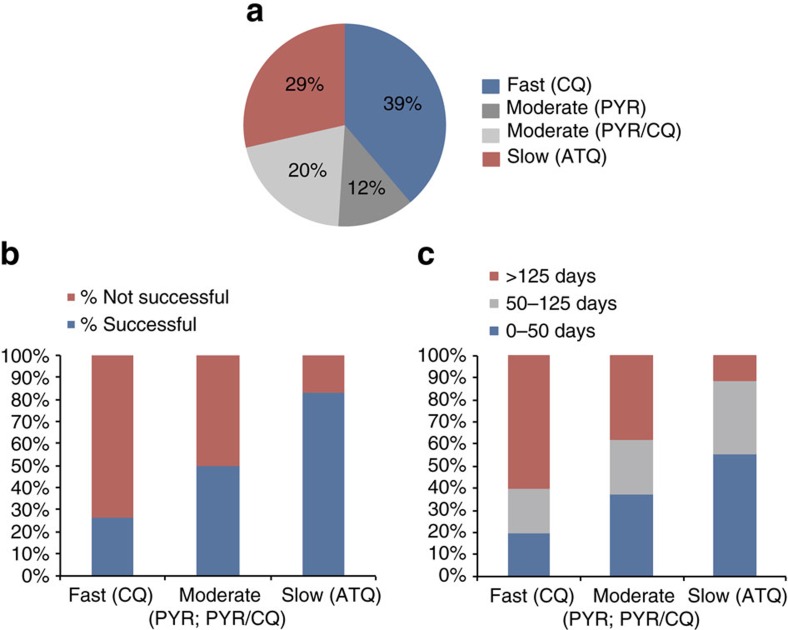
Figure 3. Killing rate trends.
(a) Proportion of fast (CQ), moderate (PYR or PYR/CQ), and slow (ATQ) compound killing rates in our compound set (49 compounds in analysis). (b) Proportion of failed and successful compound selections sorted by killing rate (47 compounds in analysis). (c) Successful selections further proportioned out based on amount of time required to result in resistant parasites. Trend in selection success and killing rate was found to be statistically significant (P=0.0022) by a one-tailed Fisher's exact test.

