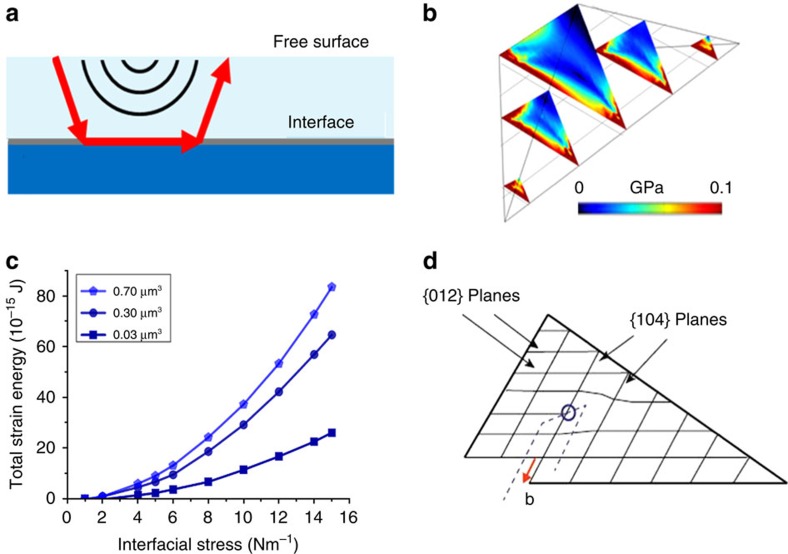
Figure 5. Dislocation geometry.
(a) Schematic of a classical ‘epitaxy' misfit dislocations (red arrow), between two materials with a close lattice match. (b) Calculated stress distribution inside a calcite tetrahedron caused by an interfacial stress. The von Mises stress distribution is shown in vertical slices through the crystal. The interfacial stress was set to 10 Nm−1. (c) Total elastic energy, calculated using FE, due to interfacial stress for three different sized crystals. (d) Lattice planes on a cross-section of a (012) tetrahedron, showing the configuration of a dislocation on a (104) slip plane, with a  Burgers vector. The blue circle shows where the dislocation line cuts the plane and the dashed line shows the dislocation line, which has screw character on the vertical segments and edge character on the horizontal segment (perpendicular to the plane). The red arrow shows the Burgers vector (b). This configuration is consistent with the experimental observations.

