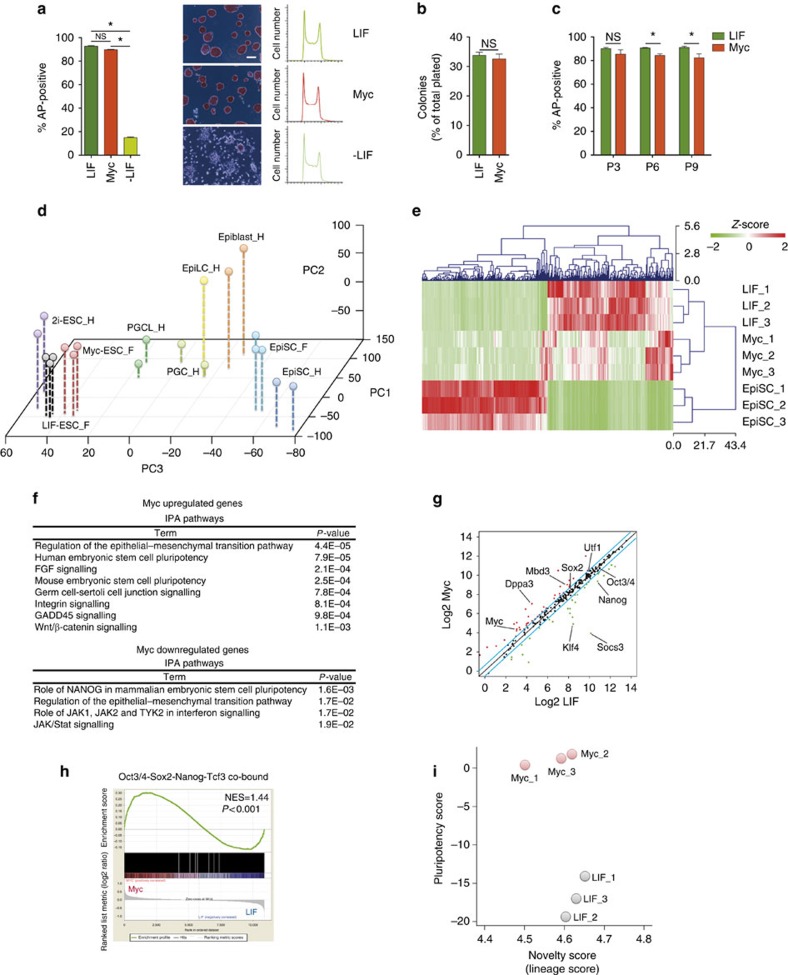
Figure 1. Myc sustains mouse ESCs identity by activating a specific transcriptional programme.
(a) Alkaline phosphatase (AP) staining of murine MycER ESCs grown for 3 days in the presence of LIF, OHT (Myc) or in -LIF conditions. Relative quantifications of positive colonies are represented as percentage of the total colonies formed. Representative images of stained ESCs maintained for 3 days in the indicated conditions (middle panels, scale bar, 200 μm) and the relative cell cycle profiles (right panels) are shown. (b) Single-cell clonogenic assay was performed and the relative number of colonies grown in the indicated conditions was quantified and represented as percentage of the total number of single-cell plated. (c) Long-term colony-forming assay was performed culturing cells in the presence of LIF or OHT (Myc) and the relative quantification of AP-positive colonies was assessed at the indicated passages, until 18 days. (d) Principal component analysis (PCA) of gene expression profile of ESCs grown in the presence of either LIF (LIF-ESC_F) or OHT (Myc-ESC_F) and EpiSC (EpiSC_F). Each sample is represented in triplicates and the analysis was integrated with previously published data profiling the expression pattern of 2i grown ESCs, EpiLC, EpiSC, epiblasts (E5.75), primordial germ cell-like cells (PGCLCs) and primordial germ cells (PGCs) at E9.5 (ref. 29). (e) Heat map of the most differentially expressed genes (cutoff was set to −1.5>fold change>1.5, 200 genes) between LIF-ESCs and EpiSCs. (f) Ingenuity pathway analysis (IPA) of differentially regulated genes between LIF- and Myc-dependent ESCs (n=3). (g) Scatter plot of pluripotency genes (Supplementary Data 1) expression levels, measured in LIF versus Myc-dependent ESCs (n=3). (h) Gene set enrichment analysis (GSEA) of Oct4/Sox2/Nanog/Tcf3 common target genes in Myc- versus LIF-maintained ESCs (n=3). NES=normalized enrichment score. (i) Machine-learning classification of gene expression pattern of LIF and Myc-dependent ESCs obtained by applying the PluriTest assay. The PluriTest classifier assessed the pluripotency potential of the examined biological samples on the bases of their gene expression profiles. Data in panels a, b and c are means±s.e.m. (n=3). (*P<0.05; NS, not significant; Student's t-test). See also related Supplementary Figs 1–3.

