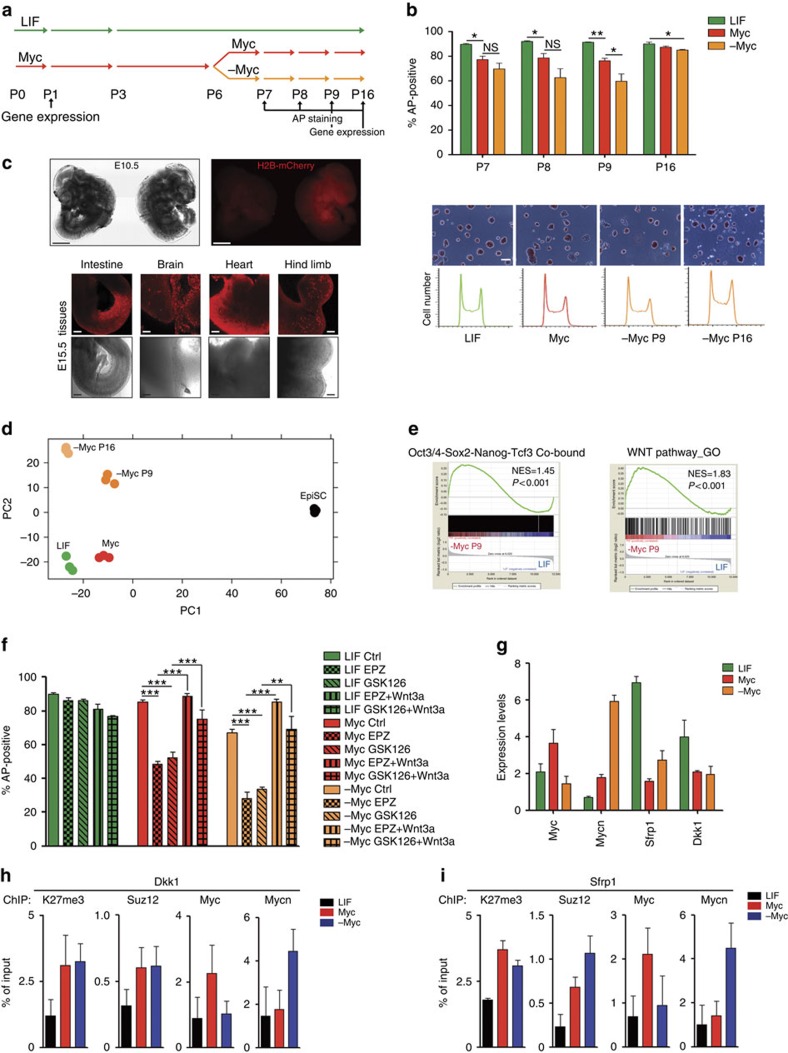
Figure 6. Myc-derived ESC acquired a PRC2-dependent epigenetic memory.
(a) Schematic representation of the experiment. R1 MycER cells were grown either in the presence of LIF (green line) or in the absence of LIF and in the presence of OHT (Myc, red line). Myc-ESCs were grown for six passages in Myc-dependency (+OHT) and then were maintained in either the same culture condition (Myc) or in the absence of both OHT and LIF (Myc-derived ESCs and indicated in figures as -Myc, orange line in panel). Alkaline phosphatase (AP) activity and gene expression profiles were analysed at indicated time points. (b) AP staining of ESCs at indicated passages and conditions. Representative images and relative cell cycle profiles are shown. Scale bar, 200 μm. (c) Fluorescence images (right panel) of a chimeric embryo at E10.5, derived from blastocysts injected with late-passages (P16) Myc-derived ESCs carrying a constitutively active H2B-mCherry transgene (right). A non-chimeric embryo is shown as non-fluorescent control (left). Relative bright-field images are shown on the left; scale bar, 1 mm. Lower panels show fluorescence images of organ tissues dissected from E15.5 chimeric embryos; scale bar, 100 μm (d). Principal component analysis (PCA) of triplicate gene expression profiles of LIF-, Myc- and -Myc-ESCs at passages 9 and 16.. Expression profiles of EpiSC are included. (e) Gene set enrichment analysis (GSEA) of Oct4/Sox2/Nanog/Tcf3 common targets (left) and Wnt pathway genes (right) in Myc-derived at passage 9 versus LIF-maintained ESCs (n=3). NES=normalized enrichment score. (f) AP staining of MycER ESCs grown 3 days in indicated conditions. EPZ and GSK126 are chemicalinhibitor of the enzymatic activity of PRC2. (g) Relative transcriptional levels of indicated genes in the LIF-, Myc- or Myc-derived ESCs (-Myc). (h,i) ChIP on MycER ESCs maintained in LIF- or Myc-dependency or the Myc-derived ESCs (-Myc). The level of H3K27me3 and the binding of Myc, Mycn and Suz12 at the TSS of the indicated genes were measured. Data in panels b and f–i are means±s.e.m. (n=3). (*P<0.05; **P<0.01, ***P<0.001; NS, not significant; Student's t-test). See also related Supplementary Figs 8–10.

