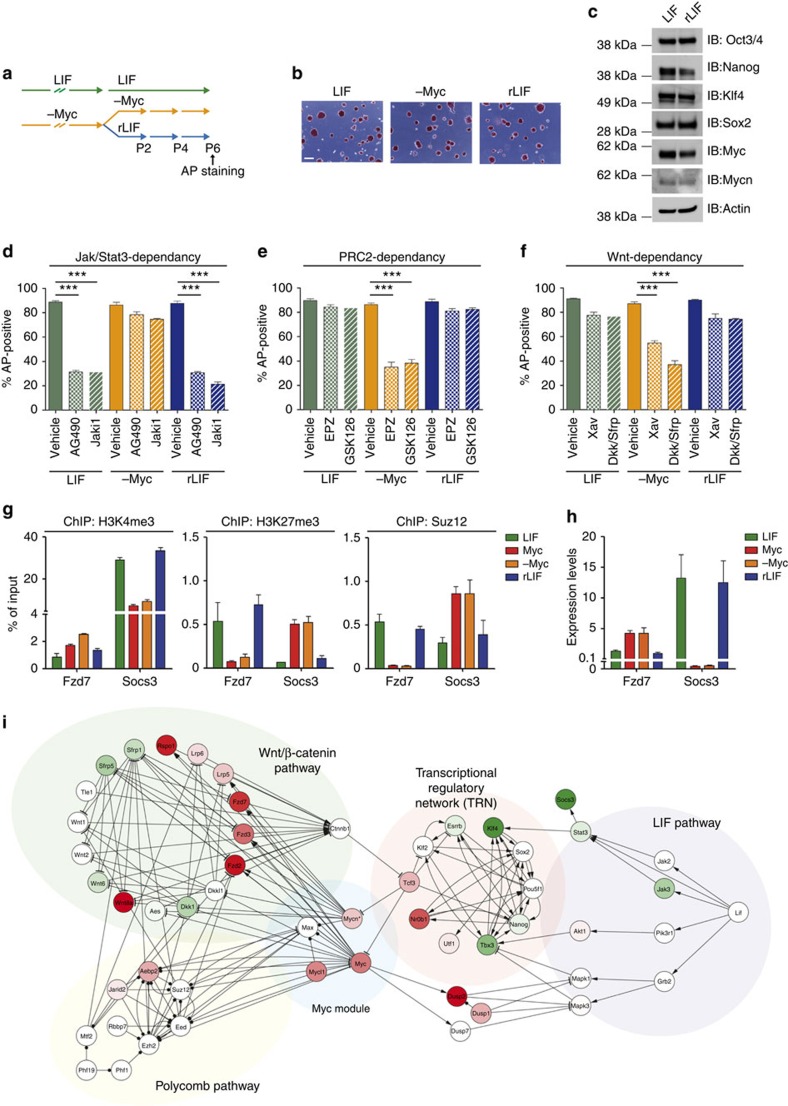
Figure 7. Myc-derived ESCs can be reverted to a LIF-dependent state.
(a) Schematic representation of the experiment. R1 MycER cells were grown either in the presence of LIF (LIF, green line) or in the absence of both LIF and OHT, after OHT withdrawal (-Myc, orange line). These Myc-derived ESCs were either maintained in the same culture condition (-Myc) or they were reverted back to a LIF-containing culture medium (rLIF, blue line). Alkaline phosphatase (AP) staining was analysed at indicated time points. (b) Representative images of P staining of ESCs grown in the indicated conditions (scale bar, 200 μm. (c) Western blot analysis of pluripotency and Myc(s) transcription factors in LIF- and rLIF-ESCs. Immunostaining (IB) analysis was performed using the indicated antibodies; β-actin was used as loading control. (d–f) AP staining to assess Jak/Stat3- (d), PRC2- (e) and Wnt-dependency (f) of LIF-, -Myc- and rLIF-ESCs. Cells were grown in the absence (vehicle) or presence of indicated drugs (AG490 and Jaki1, EPZ and GSK126, Xav and Dkk1/sFRP1 were used to respectively inhibit Jak/Stat3 pathway, PRC2 activity and WNT pathway). (g) ChIP on LIF-, Myc-, -Myc- and rLIF-ESCs. The levels of H3K4me3, H3K27me3 and Suz12 at the TSS of the indicated genes were measured. (h) Relative transcriptional levels of Fzd7 and Socs3 in ESCs maintained in LIF-, Myc-, -Myc- and rLIF-ESCs, as measured by qRT–PCR analysis. Data in panels d–h are means±s.e.m. (n=3). (***P<0.001; Student's t-test). (i) Network visualization of the Myc-mediated machinery to sustain ESCs self-renewal. The four main molecular modules are shown, from right to left: the LIF signal transduction module, the core transcriptional regulatory network, the Wnt/β-catenin pathway and the Polycomb module. Network edges were manually curated according to literature knowledge, laboratory findings and completed querying interaction repositories: they indicate activation (arrowheads), inhibitions (T-shaped heads) and physical interactions (circle-shaped head). Microarray expression values (LIF/Myc ratios) of genes or RT–qPCR expression values from validation experiments (*) are overlaid onto network depicting the LIF/Myc ratios (from green for higher LIF to red for higher Myc).

