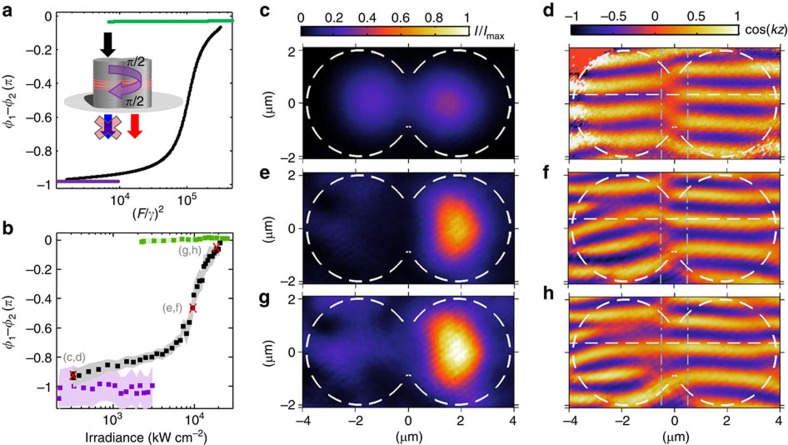
Figure 4. Interaction-induced hopping phase.
(a) Calculated and (b) measured phase difference between the intracavity fields for the three branches experimentally observed in Fig. 3. The phase difference φ1–φ2 is shown in purple for the low-density branches, in green for the high-density branches and in black for the middle branches (where driven cavity exhibits a dip in the population). The shaded areas in (b) correspond to 2σ (≈95%) confidence intervals, that is, two standard deviations, on the fits performed to retrieve the phase of each cavity (see Methods). (c–h) show three representative density (central panels) and normalized interferogram (right panels) plots along the middle branch. The effective hopping phase φ1–φ2 and irradiance corresponding to each one of these three cases is marked by a red cross in (b). The colour bar on top of panel (c) applies to all three density plots (c,e,g), while the colour bar on top of panel (d) applies to all three normalized interferograms in (d,f,h). The vertical dash-dotted lines in (d,f,h) indicate where cosine functions were fitted to the normalized interferogram to retrieve the phase of each cavity. The horizonal dashed lines in (d,f,h) are all at the same position and serve as guides to the eye.

