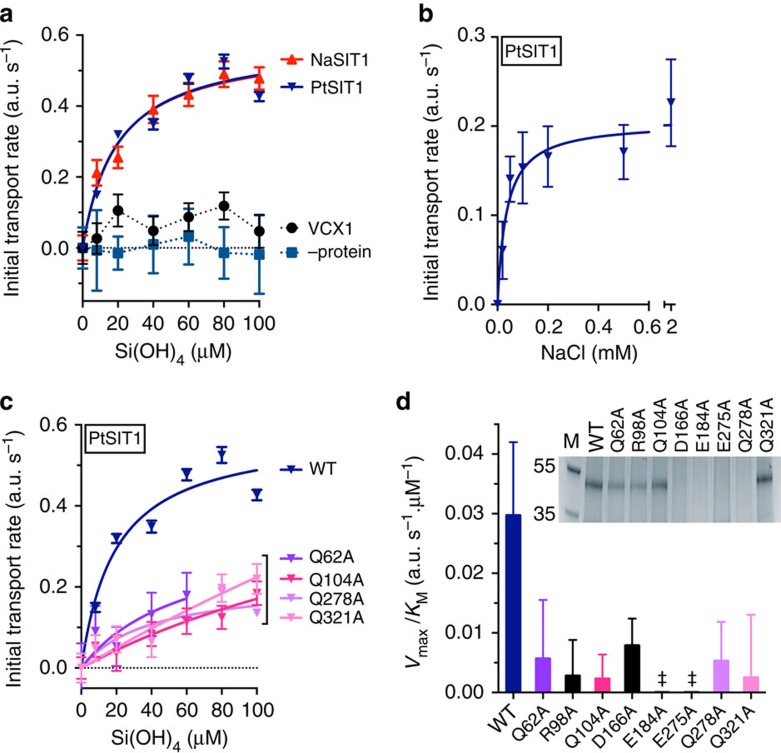
Figure 5. Transport kinetics of SIT proteoliposomes.
(a) Silicic acid dependence. (b) Sodium dependence of PtSIT1 at 40 μM silicic acid. (c) Silicic acid transport is diminished by mutations at conserved glutamines as shown. For panels a–c, each datapoint is mean±s.e.m from a linear fit to the average of four technical replicates (d). Transport activity of WT versus mutants. (‡), not determined because data could not be fit to the Michaelis–Menten equation. Inset, Coomassie-stained SDS–PAGE gel of purified mutants. Data are mean±s.e.m from fitting to the Michaelis–Menten equation.

