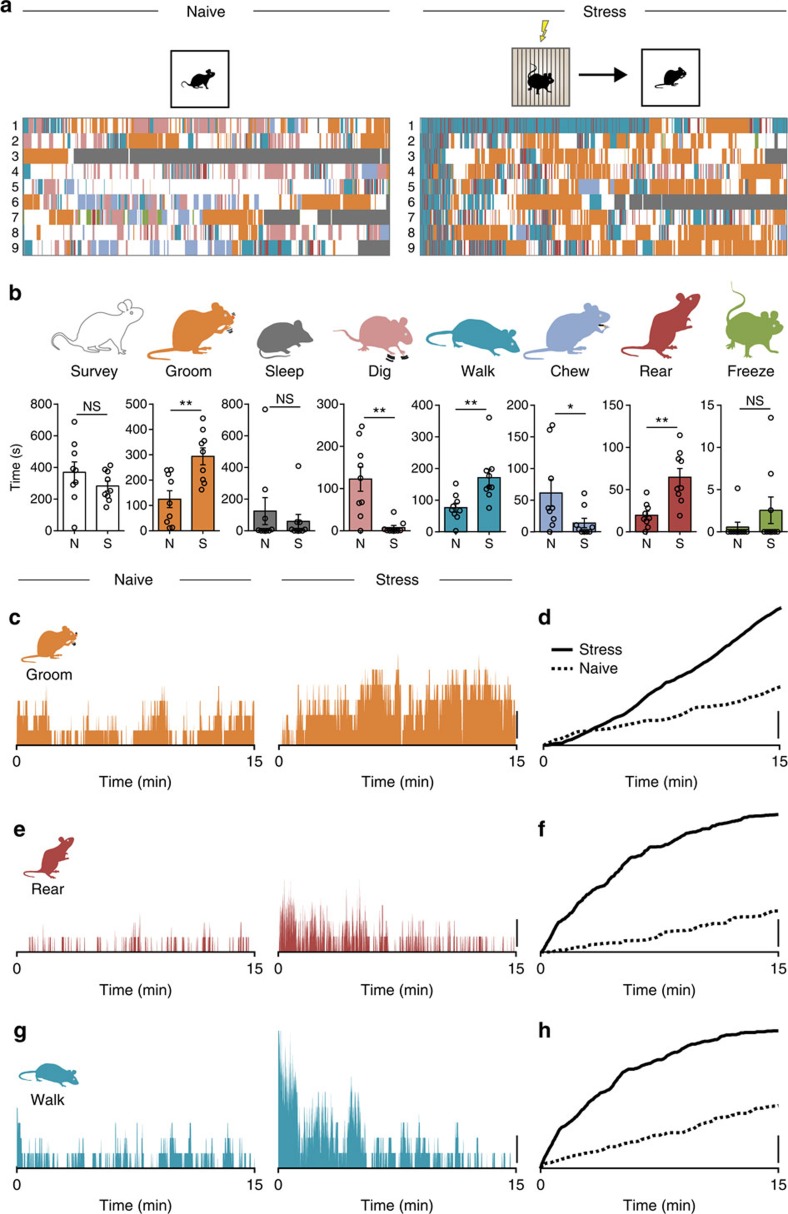
Figure 1. Distinct and temporally organized behavioural patterns emerge following stress.
(a) Quantification of behavioural activity in 15-min epochs in homecage (HC) of naïve mice and mice immediately after footshock. Eight distinct behaviours are evident in naïve (N, left) and stressed (S, right) mice. Each row represents one mouse. (b) Grooming (naïve: 124.8±33.2 s, n=9 versus stressed: 294.0±33.4 s, n=9; P=0.0024; t-test), rearing (naïve: 19.7±4.8 s, n=9 versus stressed: 64.7±10.0 s, n=9; P=0.0012; t-test) and walking (naïve: 76.4±14.2 s, n=9 versus stressed: 171.4±27.0 s, n=9; P=0.0067; t-test) are increased after stress. Time spent digging (naïve: 122.5±28.9 s, n=9 versus stressed: 7.5±5.0 s, n=9; P=0.0012; t-test) and chewing (naïve: 61.5±21.1 s, n=9 versus stressed: 14.0±7.4 s, n=9; P=0.0492; t-test) are decreased. Surveying (naïve: 369.9±65.1 s, n=9 versus stressed: 282.8±31.6 s, n=9; P=0.2463; t-test), sleeping (naïve: 124.3±85.3 s, n=9 versus stressed: 59.5±44.4 s, n=9; P=0.5096; t-test) and freezing (naïve: 0.6±0.6 s, n=9 versus stressed: 2.6±1.6 s, n=9; P=0.2541; t-test) are unaffected. (c–h) Percentage of animals exhibiting stated behaviour at each timepoint and cumulative graphs illustrating the relative extent of grooming (c,d), rearing (e,f) and walking (g,h). Scale bars: c–h, 20%; NS, not significant; *P<0.05; **P<0.01; Error bars±s.e.m.

