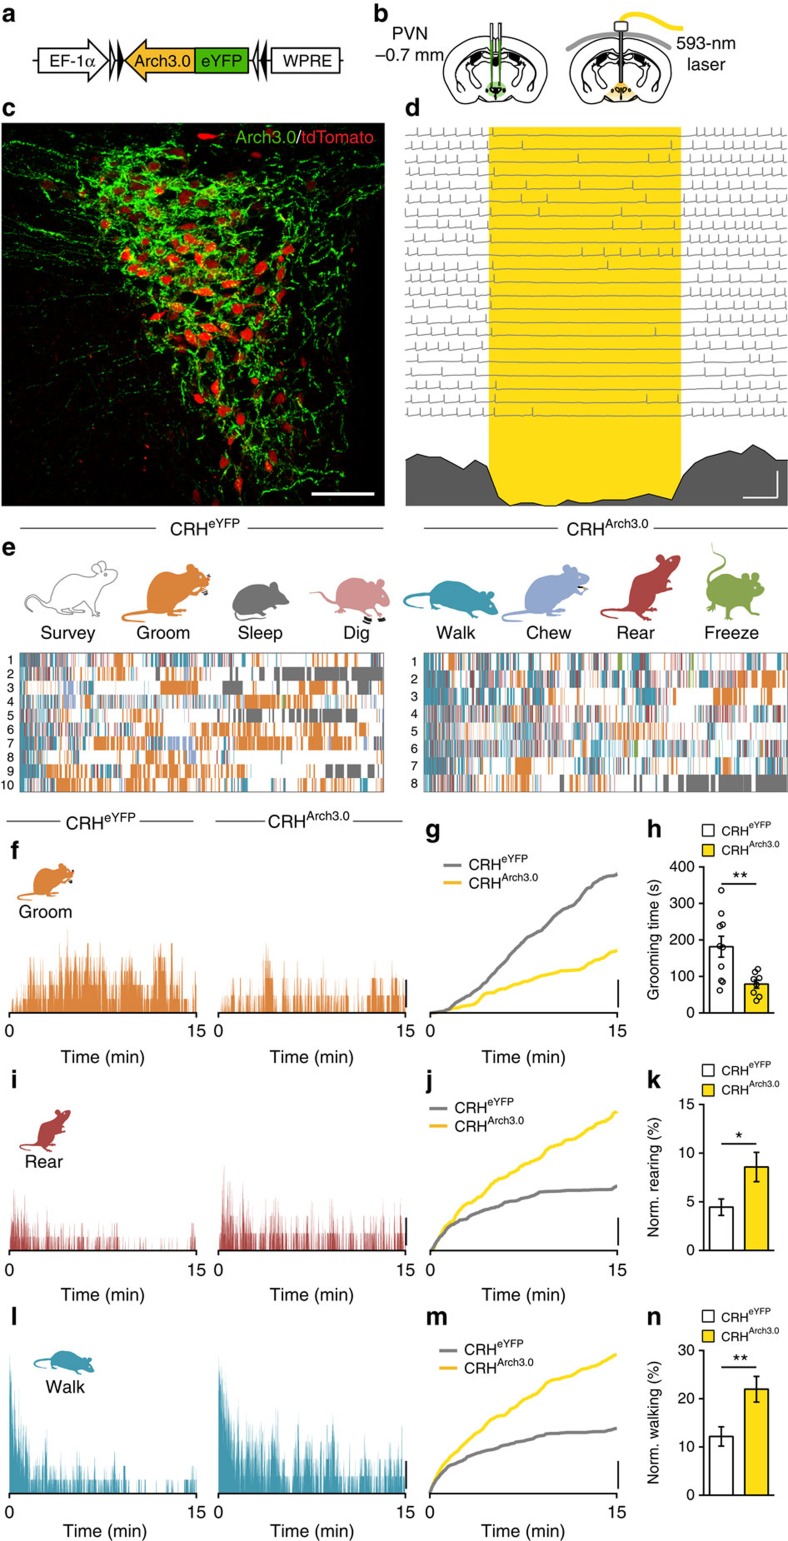
Figure 2. Photoinhibition of PVN CRHArch3.0 neurons disrupts behavioural patterns after stress.
(a) Cre-dependent AAV-DIO-Arch3.0-eYFP virus injected into the PVN. (b) Schematic maps show the injection site (left) and the implantation site of the light ferrule (right). (c) Confocal image shows expression of Arch3.0-eYFP (green) and tdTomato (red) in the PVN. (d) Delivery of yellow light to the slice (denoted by yellow box) decreases firing in PVN CRH neurons in current clamp. Bottom, Summary histogram below of action potentials form repeated trials. (e) Detailed analysis shows all eight behaviours in CRHeYFP (left) and CRHArch3.0 (right) animals in a 15-min epoch immediately after footshock. Each row represents one animal. (f) Histograms show percentage of animals grooming in each group during the 15-min observation period. (g) Cumulative graph illustrates the relative grooming in each condition. (h) Summary graphs show grooming is inhibited during optical inhibition of PVN CRH neurons (CRHeYFP: 181.4±28.7, n=10 versus CRHArch3.0: 79.0±11.2, n=8; P=0.0080; t-test). (i) Histograms show percentage of animals rearing in each group during the 15-min observation period. (j) Cumulative graph illustrates the relative rearing. (k) Rearing time, as a fraction of all non-grooming behaviours, is increased during photoinhibition (CRHeYFP: 4.5±0.8%, n=10 versus CRHArch3.0: 8.6±1.5%, n=8; P=0.0229; t-test). (l) Histograms show percentage walking in each group during the 15-min observation period. (m) Cumulative graph illustrates the relative walking. (n) Fractional walking time is also increased during photoinhibition of PVN CRH neurons (CRHeYFP: 12.2±2.0%, n=10 versus CRHArch3.0: 22.0±2.7%, n=8; P=0.0084; t-test). Scale bars: (c), 50 μm; (d), 2 Hz and 1 s; (f,g,i,j,l,m), 20%; NS, not significant, *P<0.05; **P<0.01; Error bars±s.e.m.

