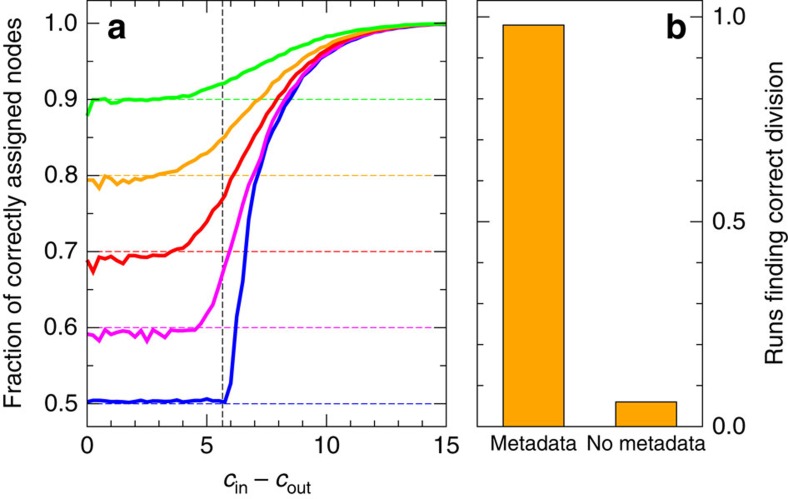
Figure 1. Tests on synthetic benchmark networks with n=10,000 nodes.
(a) Fraction of correctly assigned nodes for networks with two planted communities with mean degree c=8, as a function of the difference between the numbers of within- and between-group connections. The five curves show results for networks with a match between metadata and planted communities on a fraction 0.5, 0.6, 0.7, 0.8 and 0.9 of nodes (bottom to top). The vertical dashed line indicates the theoretical detectability threshold, below which no algorithm without metadata can detect the communities. (b) Fraction of 100 four-group test networks where the algorithm selects a particular two-way division, out of several competing possibilities, with and without the help of metadata that are weakly correlated with the desired division. A run is considered to find the correct division if the fraction of correctly classified nodes exceeds 85%. Network parameters are cout=4 and cin=20.

