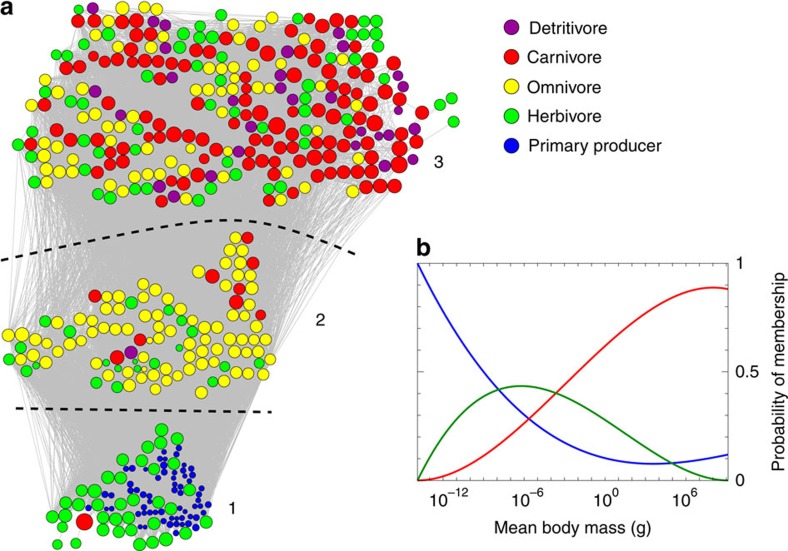
Figure 3. Results of the application of the method of this paper to the food web of marine species in the Weddell Sea.
(a) Three-way decomposition of the marine food web described in the text, with the logarithm of mean body mass used as metadata. Node sizes are proportional to log-mass, and colours indicate species role within the ecosystem. (b) Learned probabilities of belonging to each of the communities as a function of body mass. We use log mass as the metadata variable in our calculations, but the horizontal axis here is calibrated to read in terms of the original mass in grams using a logarithmic scale. The blue, green and red curves correspond, respectively, to the communities labelled 1, 2 and 3 in a.

