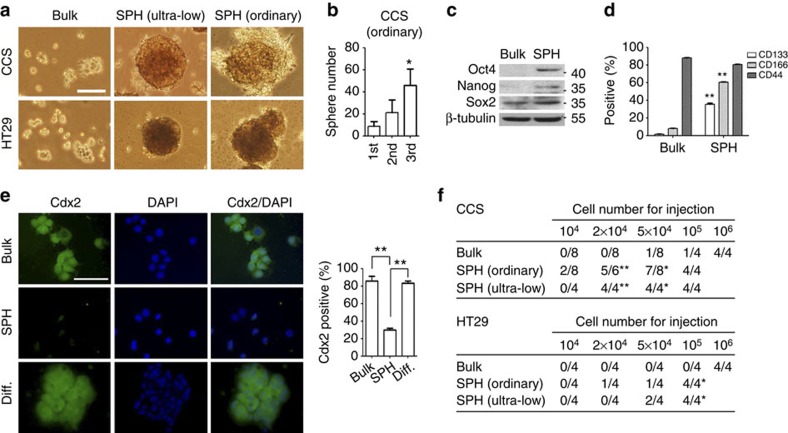
Figure 1. Characterization of spheroid culture-enriched TICs.
(a) Representative pictures of sphere formed from CCS and HT29 in spheroid culture under non-adherent (ultra-low dish) or adherent (ordinary) condition. Scale bar, 50 μm. (b) CCS cancer cells in spheroid culture were subcultured for every 15 days. Quantification of number of CCS spheres for three consequent generations with size over 250 μm for five pictures. (c) Western blot and (d) flow cytometry analysis for bulk cancer cells (Bulk) and spheroid culture-enriched TICs (SPH). (e) Left, immunostaining for Cdx2 of bulk cancer cells, spheroid culture-enriched TICs and TICs after differentiation (Diff.) in matrigel for 1 month. Scale bar, 50 μm. Right, quantification of positive cells was performed with five pictures per sample. (f) Tumorigenicity of bulk cancer cells and spheroid-enriched TICs derived from CCS and HT29 cells. The stem cell frequencices for CCS bulk and sphere culture (ultra-low) are 1:35,000 and 1:16,000, respectively, and for HT29 bulk and sphere culture (ultra-low) are 1:530,000 and 73,000, respectively. The results are expressed as mean±s.d. of three independent experiments. Asterisks indicate significant differences (*P<0.05, **P<0.01 versus first or bulk) determined by one-way analysis of variance (ANOVA; b,e), Student's t-test (d) and Fisher's exact test (f).

