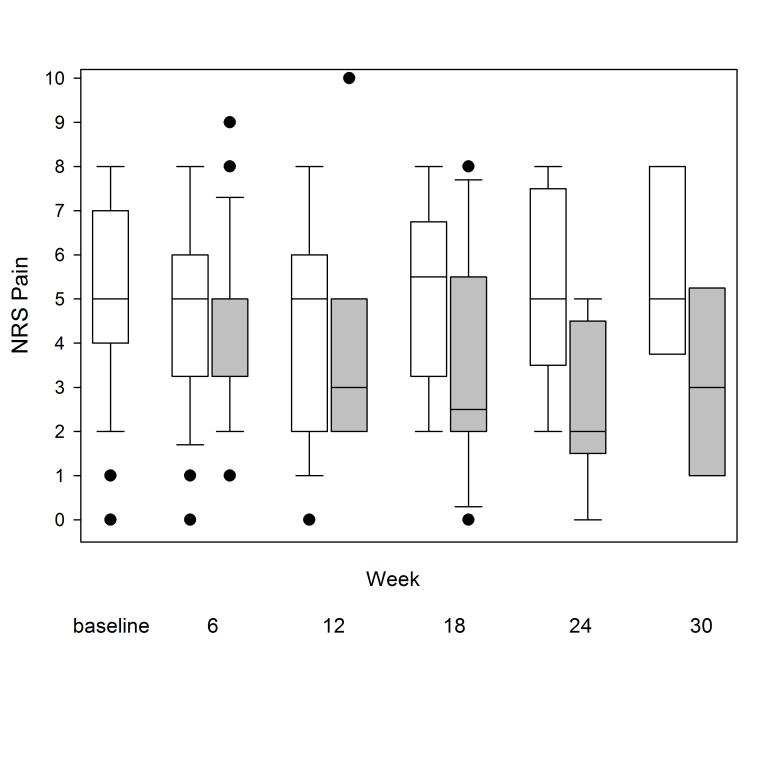
Figure 2.
Box plots of the NRS pain values (the horizontal line in the middle of each box indicates the median and the top and bottom borders of the box mark the 75th and 25th percentiles, respectively; the whiskers above and below the box mark the 90th and 10th percentiles; the black dots beyond the whiskers are outliers) at different time points. Baseline is baseline mean NRS for all 53 patients. For each subsequent time point, data are presented for those patients that participated in the program at the indicated time period (6 weeks: n=36; 12 weeks: n=19; 18 weeks: n=12; 24 weeks: n=9; 30 weeks: n=6). White boxes: baseline NRS; gray boxes: NRS after the indicated time period.

