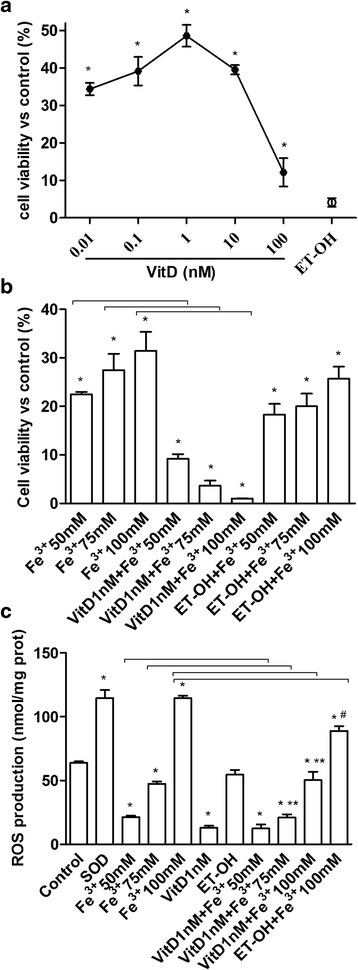
Fig. 1.

Effects of VitD on cell viability and ROS production. a, dose-response study of VitD (0.01-100 nM) on cell viability of FSEC. The results are expressed as means ± SD (%) normalized to control values of 5 technical replicates. * P < 0.05 vs control. b, MTT test performed in FSEC treated with different doses of Fe3+ (50-100 mM) alone for 6 days or pretreated with 1nM VitD for 6 days. The results are expressed as means ± SD (%) normalized to control values of 6 technical replicates. ET-OH = ethanol * P < 0.05 vs control; arrows indicate P < 0.05 between Fe3+ alone and VitD + Fe3+ c, ROS production (expressed as Cytochrome C reduced per μg of protein) in FSEC treated with different doses of Fe3+ (50-100 mM) alone for 6 days or pretreated with 1nM VitD for 6 days. The results are expressed as means ± SD of 5 technical replicates. ET-OH = ethanol. * P < 0.05 vs control; ** P < 0.05 vs VitD; # P < 0.05 vs ET-OH; arrows indicate P < 0.05 between Fe3+ alone and VitD + Fe3+
