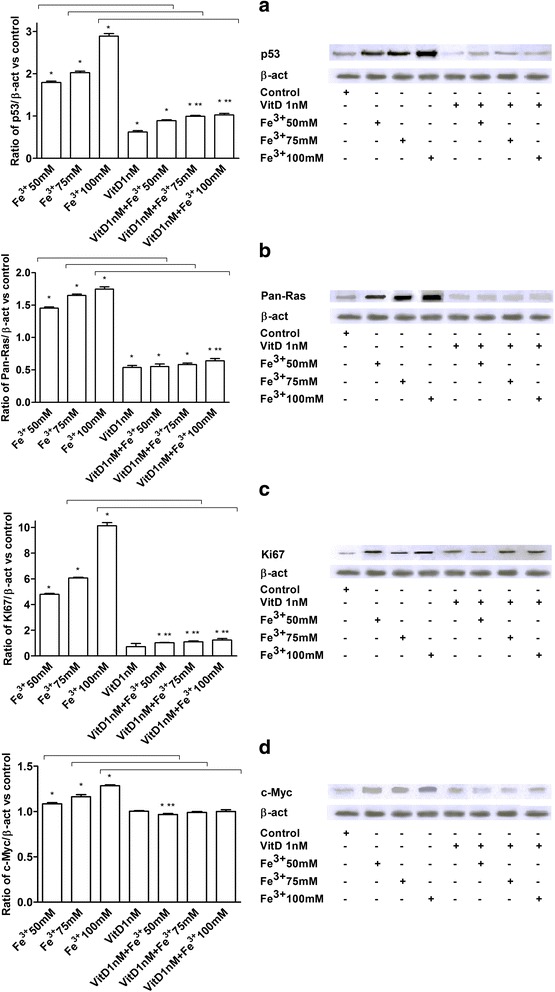
Fig. 4.

Western Blot and densitometric analysis of p53 (a), Pan-Ras (b), Ki67 (c) and c-Myc (d). Protein extracts were analyzed by immunoblotting with specific antibodies against the indicated proteins. Data are expressed as means of 5 technical replicates performed on FSEC. * P < 0.05 vs control; ** P < 0.05 vs VitD; arrows indicate P < 0.05 between Fe3+ alone and VitD + Fe3+
