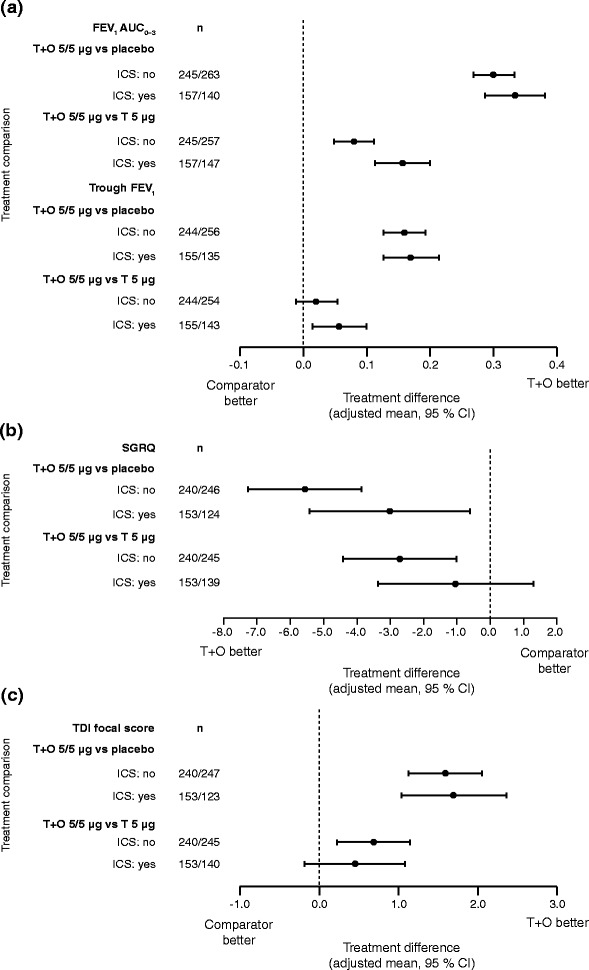
Fig. 7.

(a) FEV1 AUC0–3 and trough FEV1 responses, (b) SGRQ total score and (c) TDI focal score: treatment comparisons at 12 weeks for T + O 5/5 μg versus T 5 μg and versus placebo in patients who were receiving/ not receiving ICS treatment at baseline. FEV1: forced expiratory volume in 1 s; AUC0–3: area under the curve from 0–3 h; SGRQ: St George’s Respiratory Questionnaire; TDI: Transition Dyspnoea Index; T: tiotropium; O: olodaterol; ICS: inhaled corticosteroids; CI: confidence interval
