
Fig. 3.
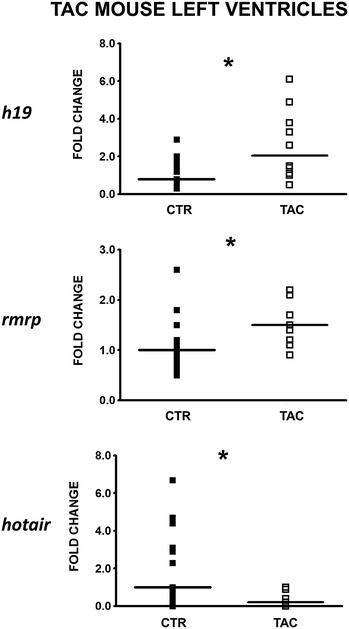
Validation of HF lncRNAs in a mouse model of cardiac hypertrophy. LV pressure overload was induced by TAC and H19, rmrp and hotair RNA levels were measured by RT-qPCR 7 days after surgery. Dot plots indicate fold change values of each subject with respect to controls. The horizontal bars indicate median values (TAC = 10; CTR = 15; *p ≤ 0.05)