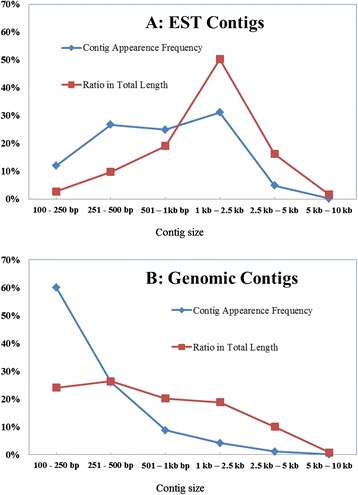
Fig. 1.

The distribution of the assembled contigs in different sizes. Chart A and B has showed the size distribution of the assemble EST and genomic contigs respectively. The line in blue indicated the appearance frequencies of the contigs in different size, and the red line showed the corresponding ratio in total length
