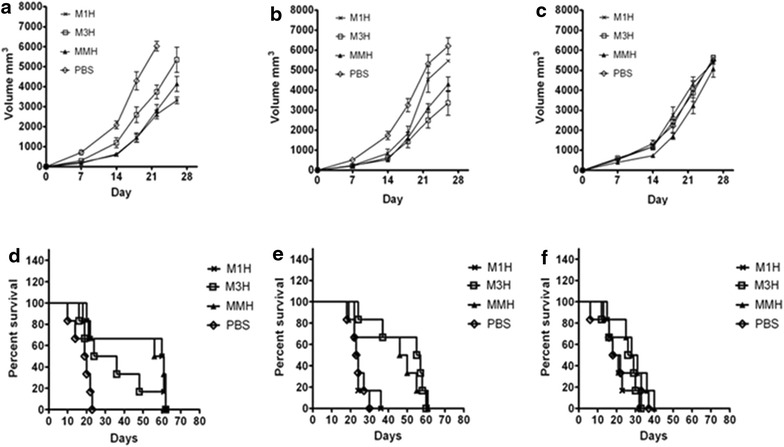
Fig. 5.

Tumor growth curve reflected by tumor volume and Kaplan–Meier survival curve. a–c Tumor volume of rM1H, rM3H, MMH and PBS mice challenged with HepG2 (a), A549 (b) and HHCC (c) cells. d–f Kaplan–Meier survival curve of rM1H, rM3H, MMH and PBS mice challenged with HepG2 (d), A549 (e) and HHCC (f) cell lysate
