Fig. 1.

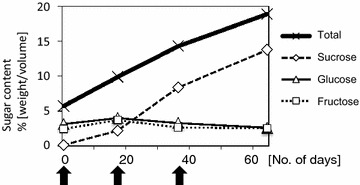
Sugar contents after heading. Y-axis indicates sugar content (weight/volume). X-axis indicates the number of days after heading, and the arrow indicates the point of sampling for RNA-seq

Sugar contents after heading. Y-axis indicates sugar content (weight/volume). X-axis indicates the number of days after heading, and the arrow indicates the point of sampling for RNA-seq