
Fig. 1.
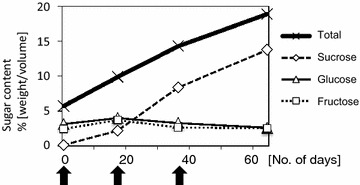
Sugar contents after heading. Y-axis indicates sugar content (weight/volume). X-axis indicates the number of days after heading, and the arrow indicates the point of sampling for RNA-seq
Official websites use .gov
A
.gov website belongs to an official
government organization in the United States.
Secure .gov websites use HTTPS
A lock (
) or https:// means you've safely
connected to the .gov website. Share sensitive
information only on official, secure websites.
Sugar contents after heading. Y-axis indicates sugar content (weight/volume). X-axis indicates the number of days after heading, and the arrow indicates the point of sampling for RNA-seq