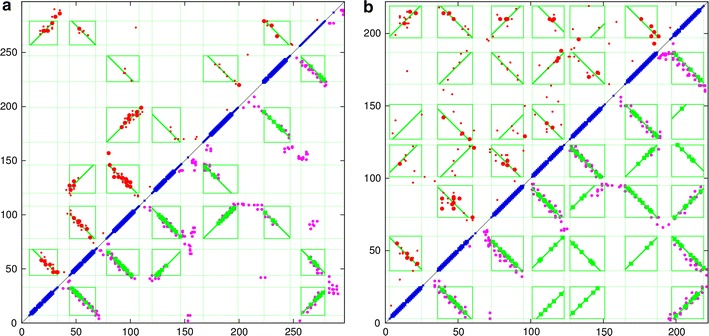
Fig. 5.

Rhodopsin parsed contact maps (fixed ends). The TM segments predicted by TOPCONS are plotted in blue along the diagonal (with a larger mark where all methods agree). Each pair of segments defines an interaction box (green) and the predicted contacts (red dots, top left) that fall within a box are analysed to determine a preferred packing orientation (green lines). In the lower right half of the plot, the lines are marked at the points corresponding to the orthogonal projection of the predicted points onto the line. For comparison, the contacts observed on the known structure are marked with magenta dots. a Data for the eukaryotic rhodopsin family (PDB code: 1gzm) and b a similar plot for the bacteriorhodopsin protein (PDB code: 2brd)
