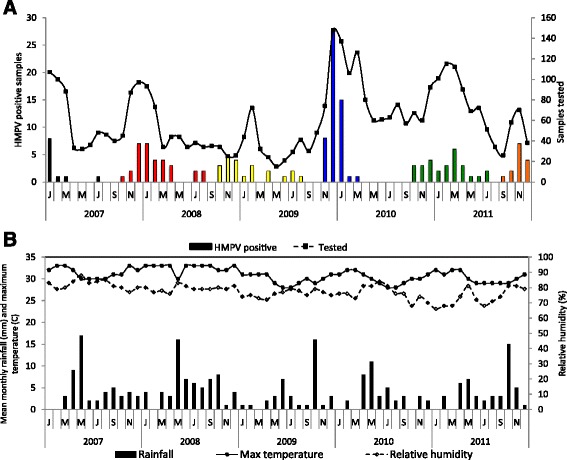
Fig. 1.

a Temporal distribution of HMPV positive samples in Kilifi over five years, showing number of positive samples each month on the primary axis and number of samples tested monthly on the secondary axis. Different colours indicate the different epidemics the samples were assigned; b Monthly weather patterns in Kilifi, Kenya in the period 2007–2011
