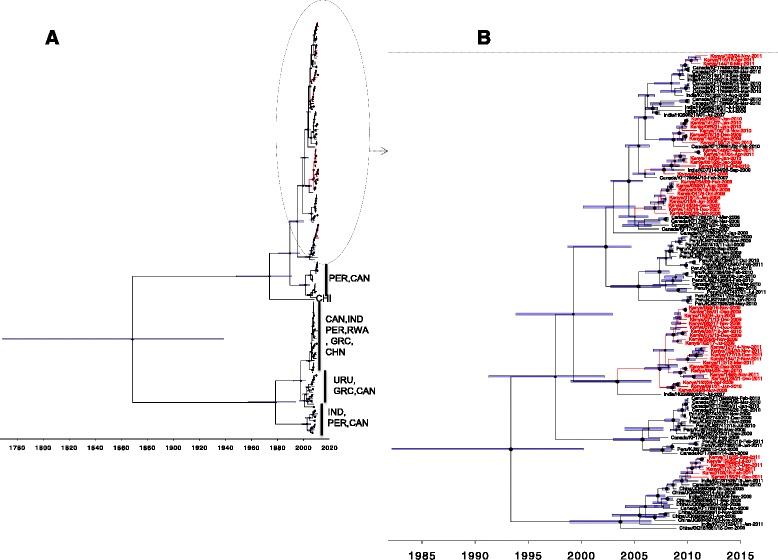
Fig. 3.

Phylogenetic and temporal placement of Kilifi group A G protein sequenced viruses, for Kilifi, coastal Kenya 2007–2011. Panel a A total of 209 viruses compared in G sequences G (53 from Kilifi and 156 collated from GenBank from 7 countries). Branches leading to Kilifi viruses are coloured red. Three letter codes of countries comprising branches without Kilifi representative sequences are indicated next to the vertical line. Panel b 121 viruses that fell within the ancestral node leading to Kilifi viruses were reanalyzed in BEAST. Again branches and leaves of Kilifi viruses are colored red on the phylogenetic temporally calibrated tree. Node bars indicate the 95 % HPD height interval of the nodes; the node maker sizes are scaled by posterior support. The number 1, 2, 3 and 4 represent the three major and one minor cluster of sequences from Kilifi
