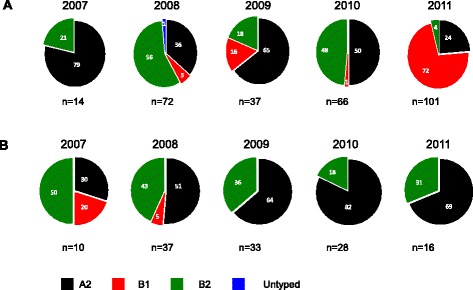
Fig. 4.

Pie charts showing the genotype distribution by year derived from F sequence analysis of samples from Kilifi, Coastal Kenya 2007-11. Panel a This is based on the 290 F sequences collated from GenBank. Panel b This is based on 123 F sequences generated from samples that were collected in this study at the KCH between 2007 and 2011. The numbers inside the pies indicate the genotype proportions per the respective year
