
Fig. 2.
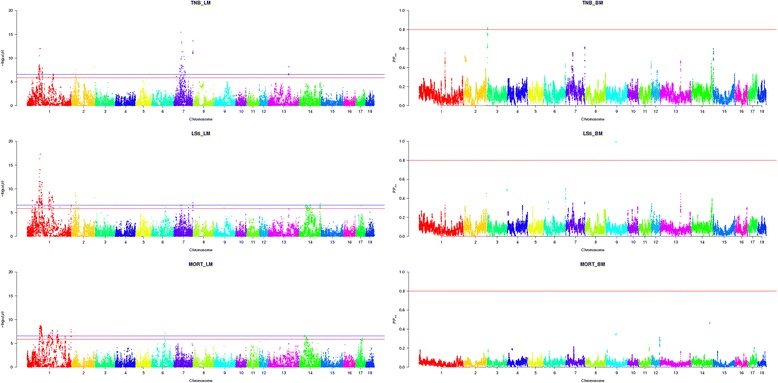
Manhattan plot of genome-wide association for reproduction traits in Yorkshire. Three plots on the left side are genome-wide P-values from a linear mixed model (LM) with single SNP regression for TNB, LS5 and MORT. The horizontal red and blue lines represent the genome-wide significance threshold at P < 0.05 and P < 0.01, respectively. Three plots on the right side are posterior probability of interval (PP int) for 1.0 Mb sliding window from a Bayesian mixture model (BM) QTL region analysis for TNB, LS5 and MORT. The horizontal red line represents the significance threshold at PP int > 0.8