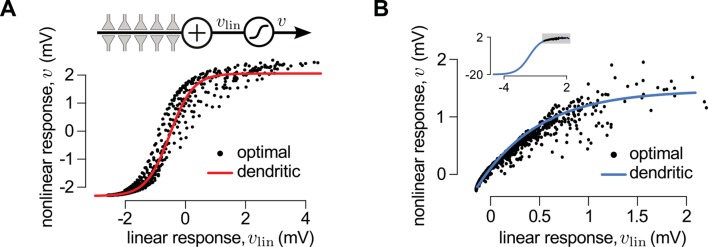
Figure 3. A canonical model of dendritic integration approximates the optimal response.
(A) The optimal response (black) and the response of a canonical model of a dendritic branch, (inset), with a sigmoidal nonlinearity (red, Equation 25) as functions of the linearly integrated input, (inset, Equation 24), when the presynaptic population exhibits synchronized switches between a quiescent and an active state, as in Figure 2D. Black dots show optimal vs. linear postsynaptic response sampled at regular ms intervals during a s-long simulation of the presynaptic spike trains. (B) Optimal response (black) approximated by the saturating part of the sigmoidal nonlinearity (blue) when the presynaptic population is fully characterized by second-order correlations, as in Figure 2A. Inset shows the same data on a larger scale to reveal the sigmoidal nature of the underlying nonlinearity (gray box indicates area shown in the main plot).


