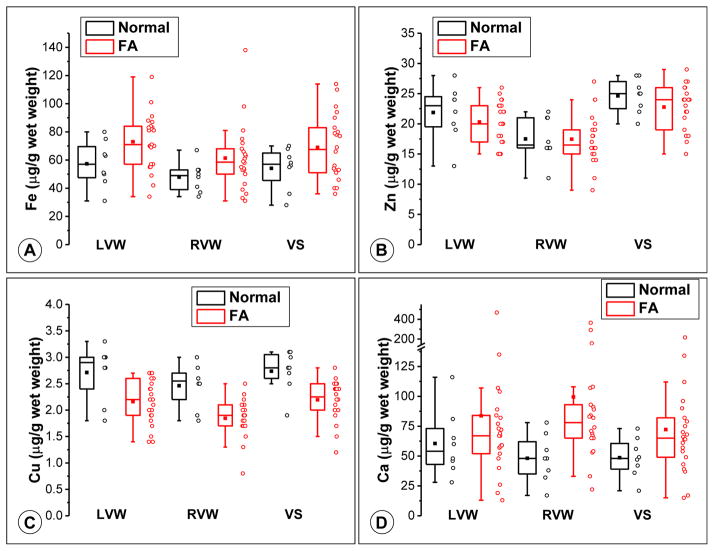
Figure 2.
Tukey box plots of Fe (A), Zn (B), Cu (C), and Ca (D) concentrations are shown together with the raw data points to the right of each box. In the box plots, the central rectangles span the first quartile to the third quartile (the IQR), and the lines within the rectangles mark the medians. The square symbols mark the means. The “whiskers” above and below the boxes are drawn to the furthest points within 1.5 × IQR from the boxes (the nonoutlier ranges). See text for the statistical analysis of the observations.

