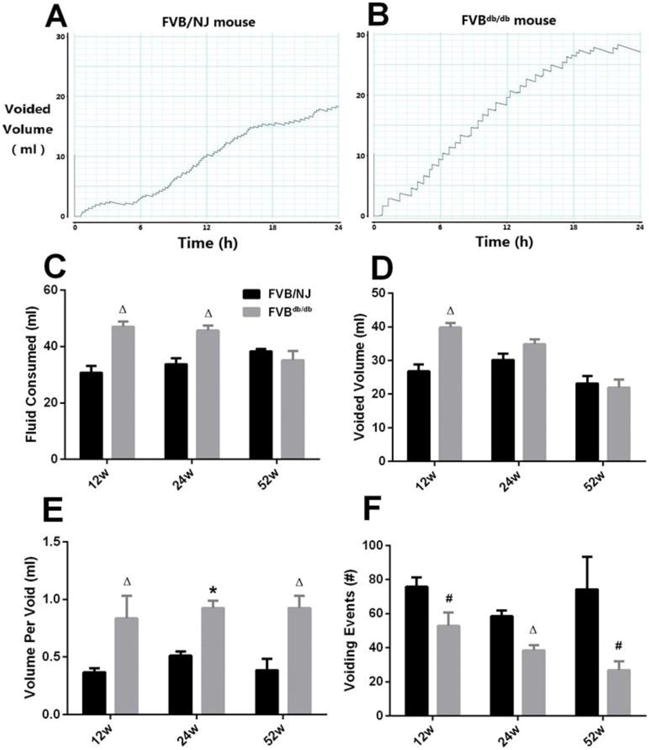
Figure 1.

Representative tracings of 24-hour urination behavior measurement from a 12-week-old male FVB/NJ (A) and a FVBdb/db (B) mouse. 24-hour fluid consumed (C) and voided volume (D), mean volume per void (E), and 24-hour urination frequency (F) were quantified and compared. Results are expressed as mean + SE. #P<0.05 vs. FVB/NJ mice at the same time point; ΔP<0.01 vs. FVB/NJ mice at the same time point; *P<0.0001 vs. FVB/NJ mice at the same time point.
