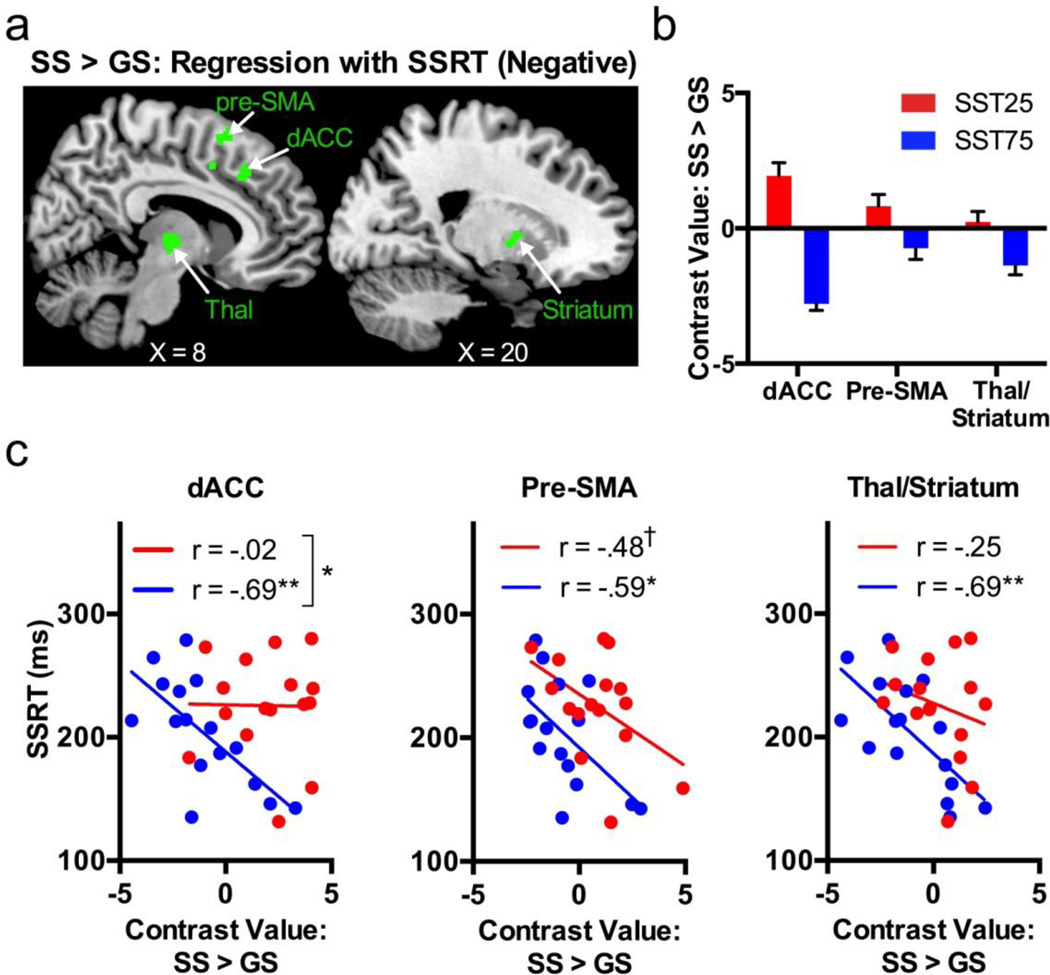
Figure 4.
a) Regions of interest analyses identified clusters that showed a negative correlation to SSRT (green) in SST75 in areas with greater activations to SS > GS in SST25 as compared to SST75; no voxels showed a positive correlation to SSRT in SST75 or any correlation to SSRT in SST25. b) Bar plot of contrast values for each cluster (error bar = standard error of the mean). c) Scatterplots for the three clusters showing a significant negative correlation between SS > GS contrast values and SSRT in SST75. SS = stop success, GS = go success, SSRT = stop-signal reaction time, dACC = dorsal anterior cingulate cortex, pre-SMA = pre-supplementary motor area; Thal = thalamus. †, p < .10; *, p < .05; **, p < .01

