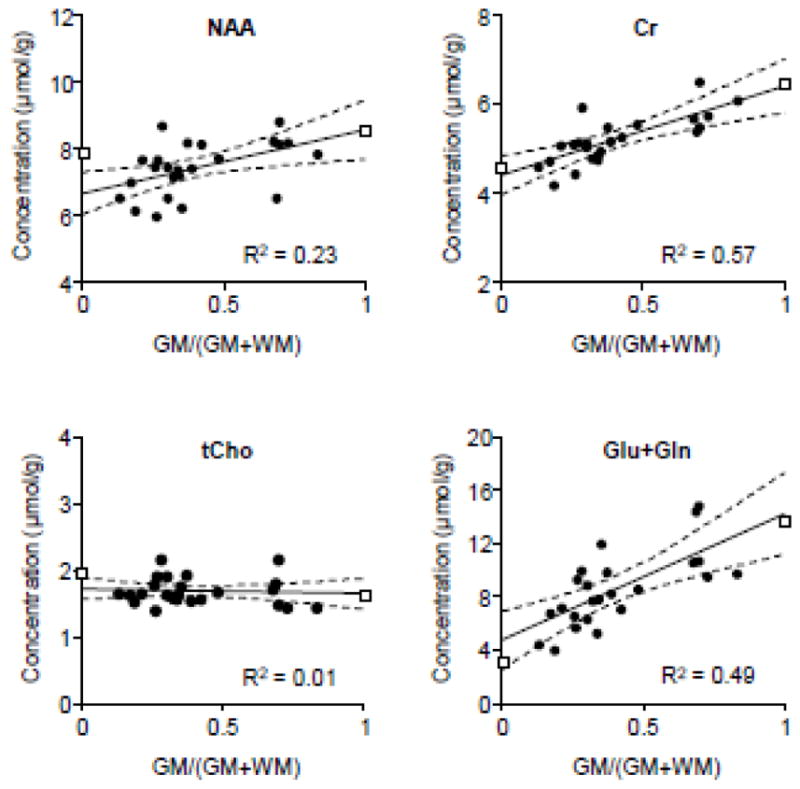
Figure 7.

An example of estimated metabolite concentrations in GM and WM using BASE-SLIM and MRSI regression. Metabolite concentrations were determined using LCModel for each MRSI voxel. Tissue GM fractions in each MRSI voxel were calculated by down-sampling high resolution GM and WM segmented images. Linear regressions of metabolite concentrations are shown in solid black lines and 95% confidence intervals in dashed lines. The ends of each regression line represent extrapolated WM and GM values of MRSI regression. Metabolite concentrations in GM and WM using BASE-SLIM reconstruction are shown in open-squares at GM fractions of one and zero, respectively. BASE-SLIM used the external boundary matching the collection of voxels included in the MRSI regression.
